| __timestamp | Union Pacific Corporation | United Parcel Service, Inc. |
|---|---|---|
| Wednesday, January 1, 2014 | 9677000000 | 26187000000 |
| Thursday, January 1, 2015 | 8976000000 | 27335000000 |
| Friday, January 1, 2016 | 8269000000 | 5467000000 |
| Sunday, January 1, 2017 | 9009000000 | 7529000000 |
| Monday, January 1, 2018 | 9539000000 | 7024000000 |
| Tuesday, January 1, 2019 | 9614000000 | 7798000000 |
| Wednesday, January 1, 2020 | 9179000000 | 7814000000 |
| Friday, January 1, 2021 | 10514000000 | 12810000000 |
| Saturday, January 1, 2022 | 11205000000 | 13094000000 |
| Sunday, January 1, 2023 | 10529000000 | 17231000000 |
| Monday, January 1, 2024 | 11039000000 | 25022000000 |
Unlocking the unknown
In the ever-evolving landscape of American industry, Union Pacific Corporation and United Parcel Service, Inc. have been titans of their respective sectors. From 2014 to 2023, these giants have showcased intriguing trends in their gross profits. Union Pacific, a stalwart in rail transportation, saw a steady increase in gross profit, peaking in 2022 with a 35% rise from its 2016 low. Meanwhile, UPS, a leader in logistics, experienced a dramatic surge, with a 215% increase from 2016 to 2023, reflecting its adaptability in a digital age. Notably, 2023 marked a significant year for UPS, with a gross profit nearly 64% higher than Union Pacific's. However, data for 2024 remains incomplete, leaving room for speculation. This comparison not only highlights the resilience of these companies but also underscores the dynamic nature of the U.S. economy.

Breaking Down Revenue Trends: Union Pacific Corporation vs United Parcel Service, Inc.

Analyzing Cost of Revenue: Union Pacific Corporation and United Parcel Service, Inc.
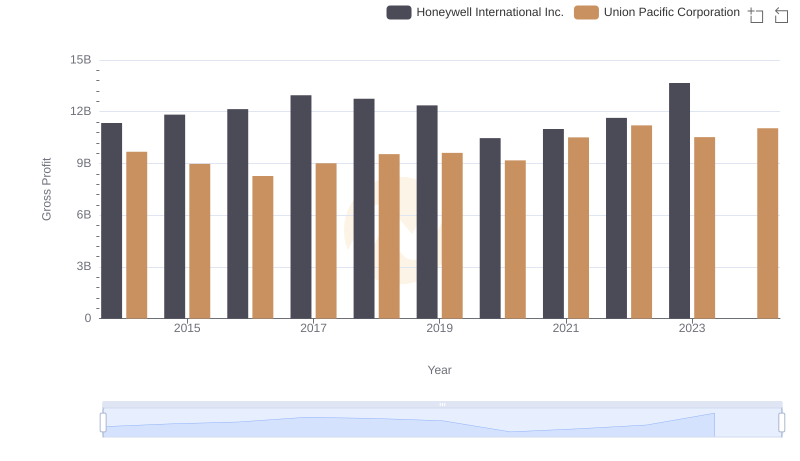
Gross Profit Comparison: Union Pacific Corporation and Honeywell International Inc. Trends

Who Generates Higher Gross Profit? Union Pacific Corporation or Waste Management, Inc.

Union Pacific Corporation vs Deere & Company: A Gross Profit Performance Breakdown
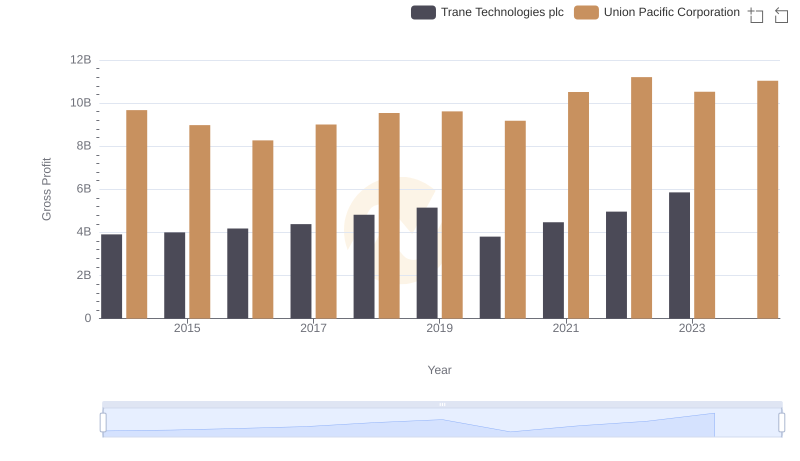
Union Pacific Corporation vs Trane Technologies plc: A Gross Profit Performance Breakdown

Union Pacific Corporation vs Cintas Corporation: A Gross Profit Performance Breakdown