| __timestamp | Union Pacific Corporation | United Parcel Service, Inc. |
|---|---|---|
| Wednesday, January 1, 2014 | 14311000000 | 32045000000 |
| Thursday, January 1, 2015 | 12837000000 | 31028000000 |
| Friday, January 1, 2016 | 11672000000 | 55439000000 |
| Sunday, January 1, 2017 | 12231000000 | 58343000000 |
| Monday, January 1, 2018 | 13293000000 | 64837000000 |
| Tuesday, January 1, 2019 | 12094000000 | 66296000000 |
| Wednesday, January 1, 2020 | 10354000000 | 76814000000 |
| Friday, January 1, 2021 | 11290000000 | 84477000000 |
| Saturday, January 1, 2022 | 13670000000 | 87244000000 |
| Sunday, January 1, 2023 | 13590000000 | 73727000000 |
| Monday, January 1, 2024 | 13211000000 | 66048000000 |
Infusing magic into the data realm
In the ever-evolving landscape of American industry, Union Pacific Corporation and United Parcel Service, Inc. stand as titans of transportation and logistics. From 2014 to 2023, these giants have navigated the complexities of cost management, with their cost of revenue revealing intriguing trends.
Union Pacific's cost of revenue has seen a modest decline of approximately 5% over the decade, reflecting strategic efficiencies in rail operations. Meanwhile, UPS experienced a dramatic 130% surge in costs from 2014 to 2022, peaking in 2022 before a notable 15% drop in 2023. This fluctuation underscores the challenges faced by logistics companies in managing operational expenses amid global supply chain disruptions.
As we look to the future, the absence of 2024 data for UPS leaves room for speculation. Will UPS continue its cost-cutting trajectory, or will new challenges arise? Stay tuned as these industry leaders adapt to an ever-changing economic landscape.

Breaking Down Revenue Trends: Union Pacific Corporation vs United Parcel Service, Inc.
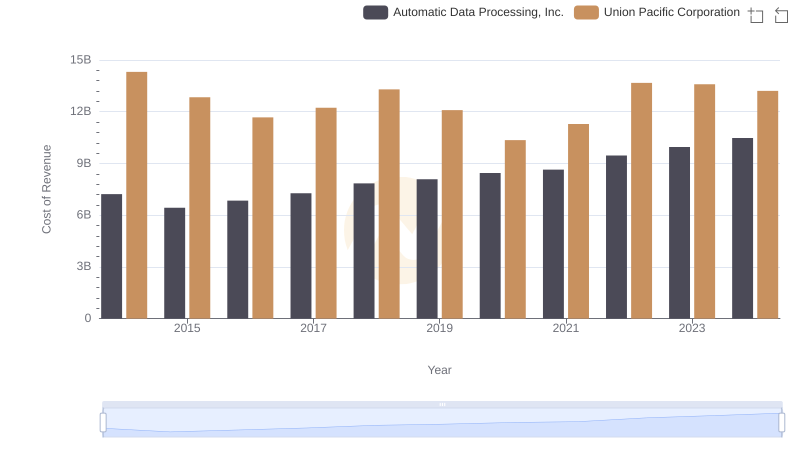
Cost of Revenue: Key Insights for Union Pacific Corporation and Automatic Data Processing, Inc.
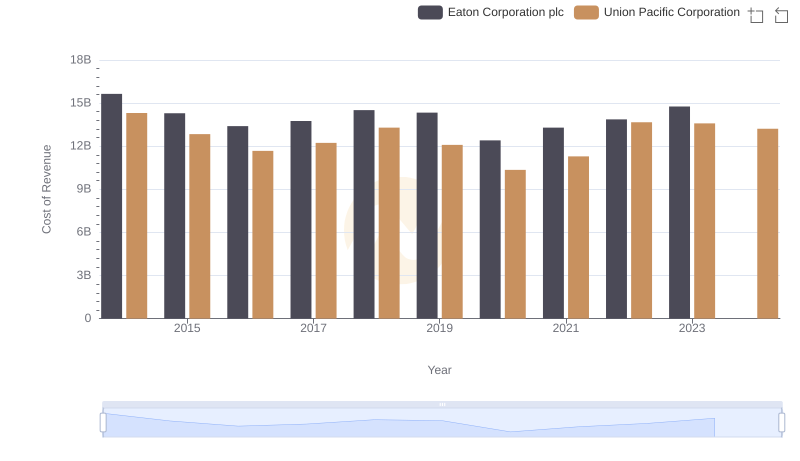
Comparing Cost of Revenue Efficiency: Union Pacific Corporation vs Eaton Corporation plc
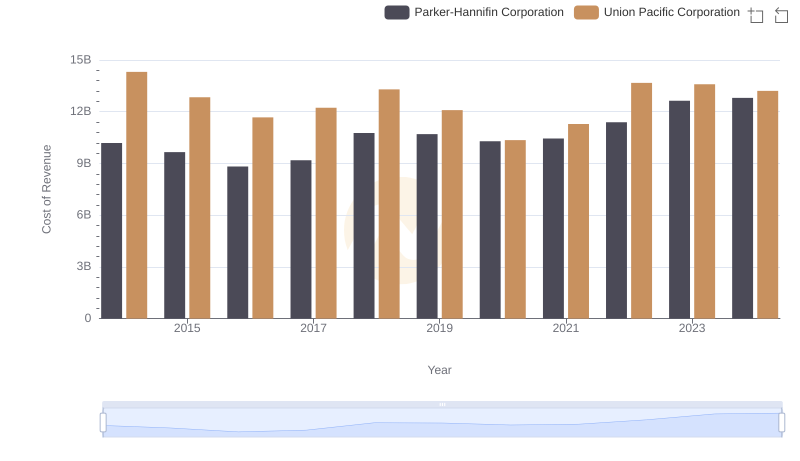
Union Pacific Corporation vs Parker-Hannifin Corporation: Efficiency in Cost of Revenue Explored

Gross Profit Comparison: Union Pacific Corporation and United Parcel Service, Inc. Trends

Cost Insights: Breaking Down Union Pacific Corporation and Trane Technologies plc's Expenses