| __timestamp | Ingersoll Rand Inc. | Parker-Hannifin Corporation |
|---|---|---|
| Wednesday, January 1, 2014 | 936781000 | 3027744000 |
| Thursday, January 1, 2015 | 779100000 | 3056499000 |
| Friday, January 1, 2016 | 716731000 | 2537369000 |
| Sunday, January 1, 2017 | 897900000 | 2840350000 |
| Monday, January 1, 2018 | 1012500000 | 3539551000 |
| Tuesday, January 1, 2019 | 911700000 | 3616840000 |
| Wednesday, January 1, 2020 | 1613400000 | 3409002000 |
| Friday, January 1, 2021 | 1988500000 | 3897960000 |
| Saturday, January 1, 2022 | 2325600000 | 4474341000 |
| Sunday, January 1, 2023 | 2882200000 | 6429302000 |
| Monday, January 1, 2024 | 0 | 7127790000 |
In pursuit of knowledge
In the competitive landscape of industrial manufacturing, Parker-Hannifin Corporation and Ingersoll Rand Inc. have showcased remarkable financial trajectories over the past decade. From 2014 to 2023, Parker-Hannifin's gross profit surged by over 110%, peaking at approximately $6.43 billion in 2023. This growth underscores its robust market strategies and operational efficiencies. In contrast, Ingersoll Rand demonstrated a steady climb, with its gross profit increasing by nearly 200% during the same period, reaching around $2.88 billion in 2023. Notably, Parker-Hannifin consistently outperformed Ingersoll Rand, maintaining a gross profit that was, on average, 2.5 times higher. However, the data for 2024 is incomplete, leaving room for speculation on future trends. This analysis highlights the dynamic shifts in the industrial sector, emphasizing the importance of strategic growth and adaptation.
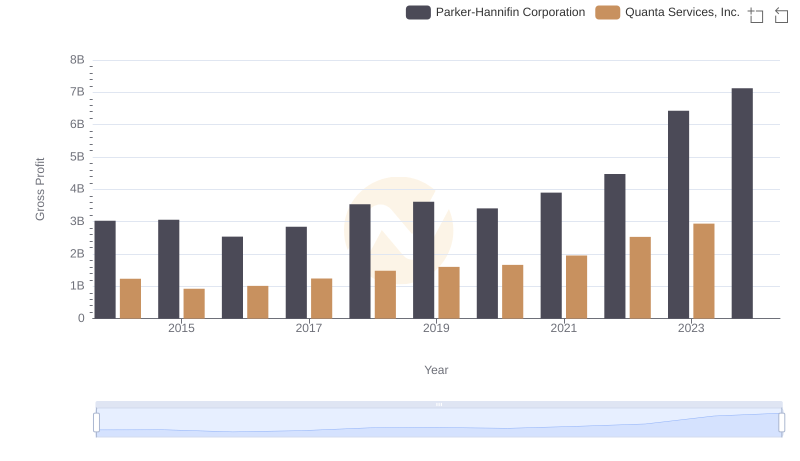
Key Insights on Gross Profit: Parker-Hannifin Corporation vs Quanta Services, Inc.
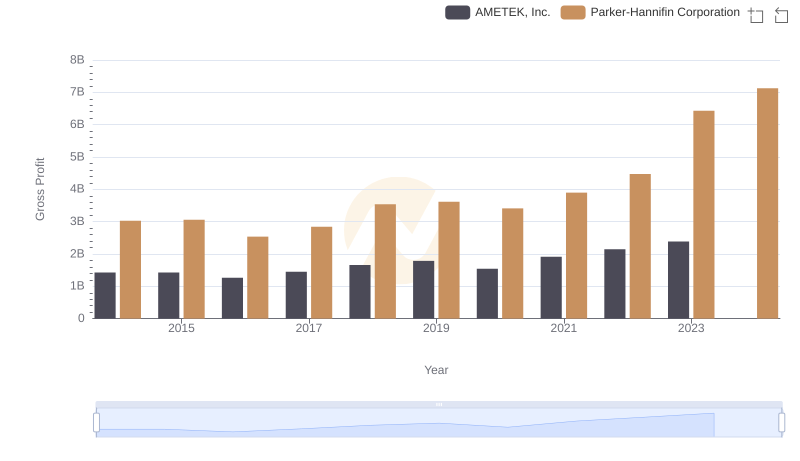
Key Insights on Gross Profit: Parker-Hannifin Corporation vs AMETEK, Inc.
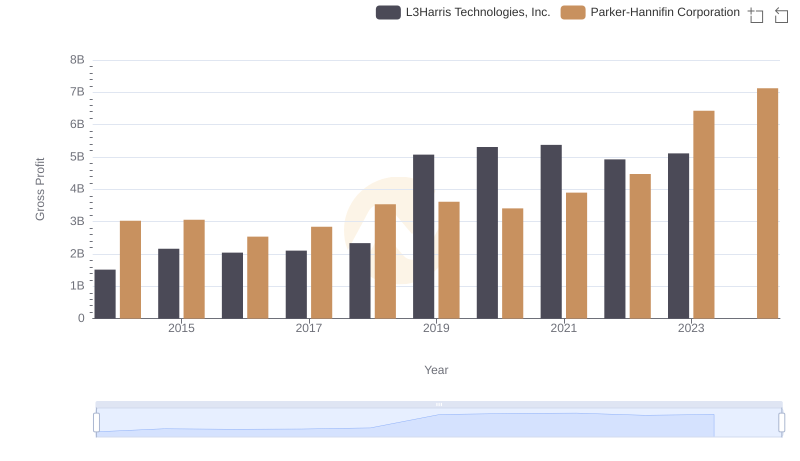
Parker-Hannifin Corporation vs L3Harris Technologies, Inc.: A Gross Profit Performance Breakdown
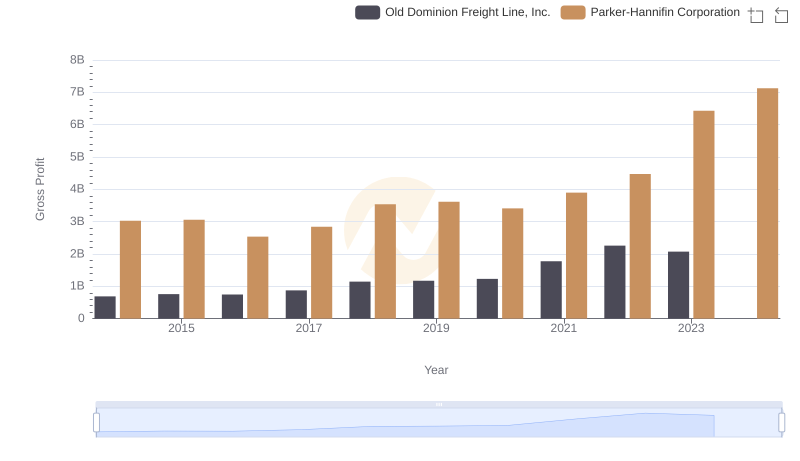
Parker-Hannifin Corporation vs Old Dominion Freight Line, Inc.: A Gross Profit Performance Breakdown

Who Generates Higher Gross Profit? Parker-Hannifin Corporation or Westinghouse Air Brake Technologies Corporation
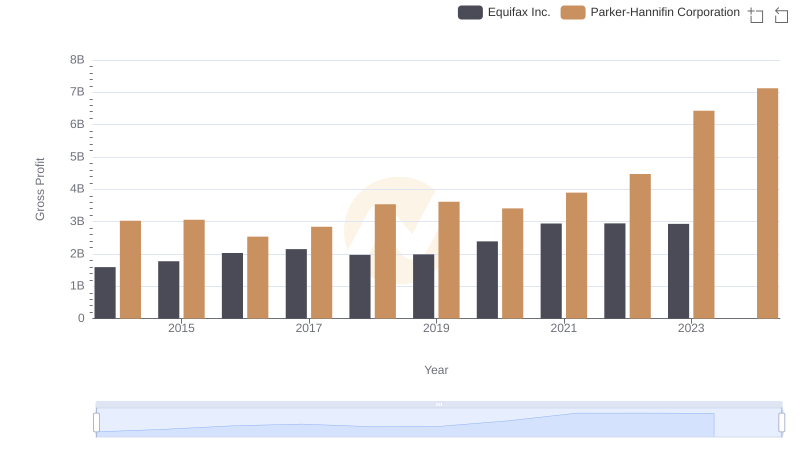
Parker-Hannifin Corporation and Equifax Inc.: A Detailed Gross Profit Analysis
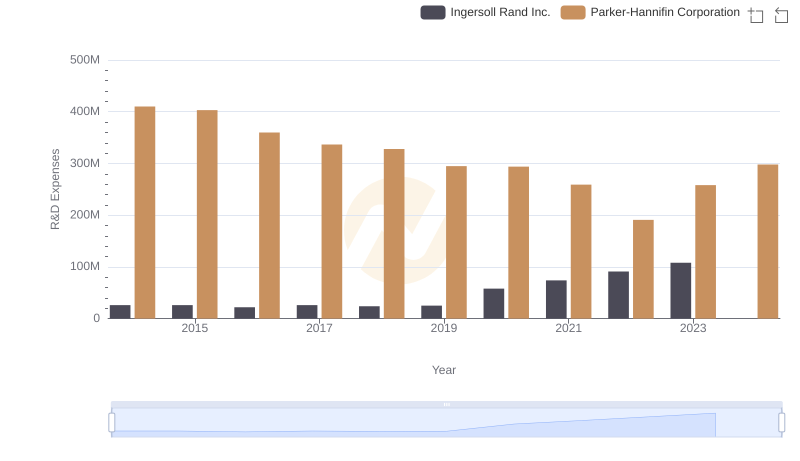
Research and Development: Comparing Key Metrics for Parker-Hannifin Corporation and Ingersoll Rand Inc.
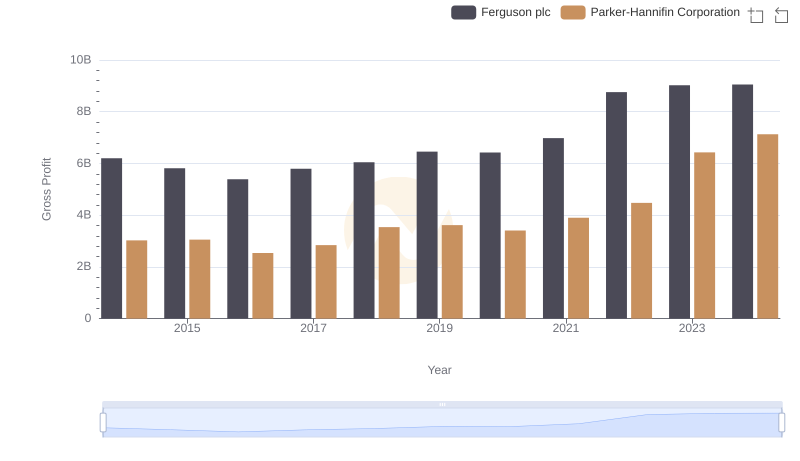
Gross Profit Comparison: Parker-Hannifin Corporation and Ferguson plc Trends