| __timestamp | Old Dominion Freight Line, Inc. | Parker-Hannifin Corporation |
|---|---|---|
| Wednesday, January 1, 2014 | 687488000 | 3027744000 |
| Thursday, January 1, 2015 | 757499000 | 3056499000 |
| Friday, January 1, 2016 | 744627000 | 2537369000 |
| Sunday, January 1, 2017 | 875380000 | 2840350000 |
| Monday, January 1, 2018 | 1144243000 | 3539551000 |
| Tuesday, January 1, 2019 | 1170216000 | 3616840000 |
| Wednesday, January 1, 2020 | 1228598000 | 3409002000 |
| Friday, January 1, 2021 | 1775060000 | 3897960000 |
| Saturday, January 1, 2022 | 2256126000 | 4474341000 |
| Sunday, January 1, 2023 | 2072199000 | 6429302000 |
| Monday, January 1, 2024 | 7127790000 |
Unlocking the unknown
In the ever-evolving landscape of industrial and freight sectors, Parker-Hannifin Corporation and Old Dominion Freight Line, Inc. have showcased remarkable financial trajectories over the past decade. From 2014 to 2023, Parker-Hannifin's gross profit surged by over 110%, peaking at approximately $6.43 billion in 2023. This growth underscores its robust market position and strategic initiatives.
Conversely, Old Dominion Freight Line, Inc. demonstrated a commendable 200% increase in gross profit, reaching its zenith in 2022. However, a slight dip in 2023 suggests potential market challenges or strategic shifts.
The data reveals Parker-Hannifin's consistent upward trend, while Old Dominion's performance highlights its resilience in a competitive freight industry. Missing data for 2024 suggests an opportunity for future analysis. This financial narrative not only reflects the companies' adaptability but also offers insights into broader industry trends.
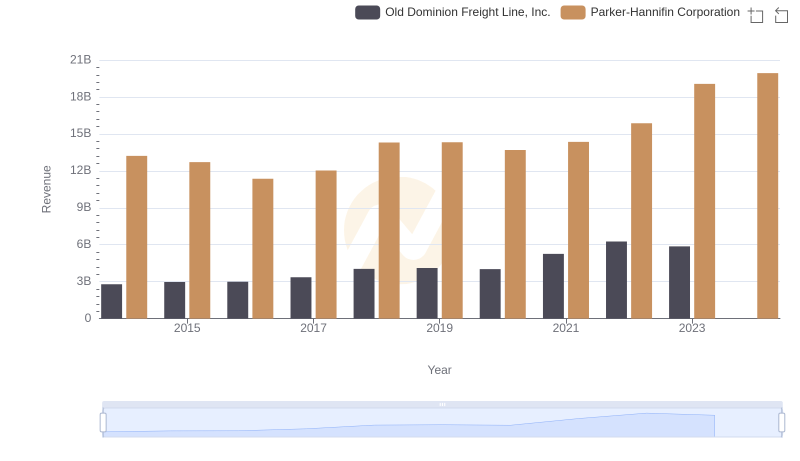
Breaking Down Revenue Trends: Parker-Hannifin Corporation vs Old Dominion Freight Line, Inc.
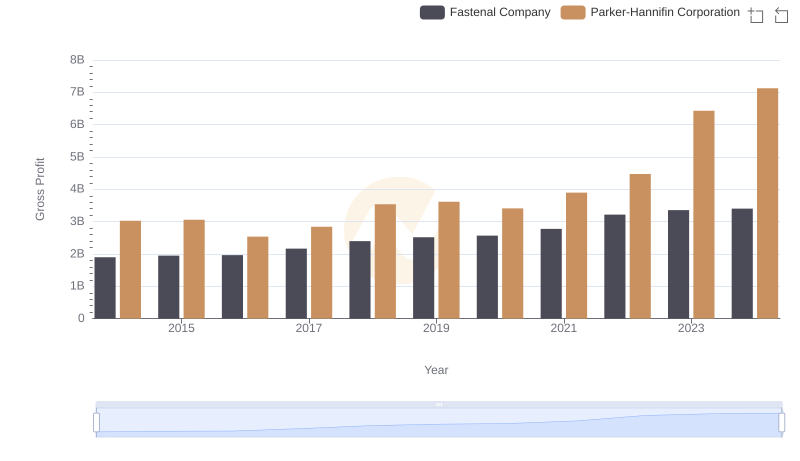
Key Insights on Gross Profit: Parker-Hannifin Corporation vs Fastenal Company
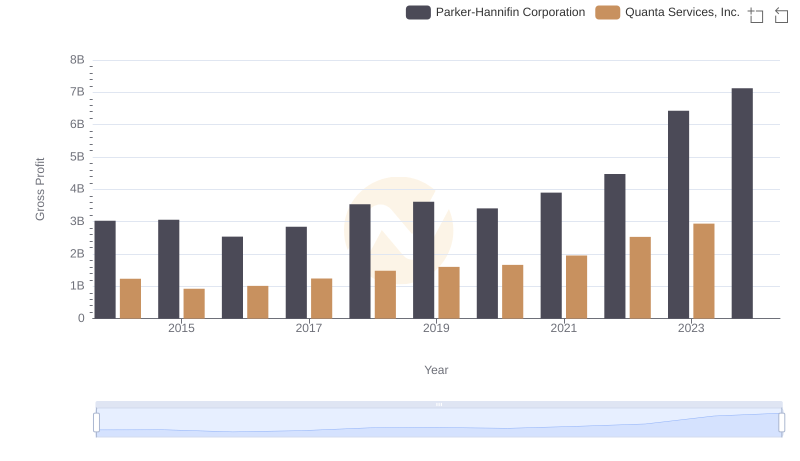
Key Insights on Gross Profit: Parker-Hannifin Corporation vs Quanta Services, Inc.
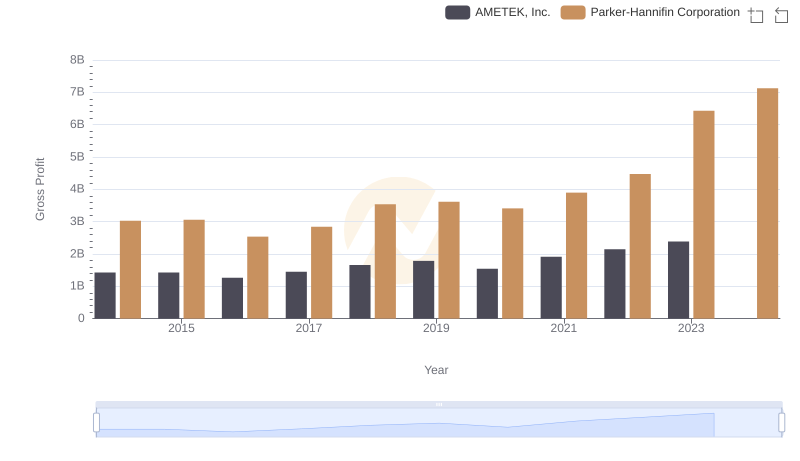
Key Insights on Gross Profit: Parker-Hannifin Corporation vs AMETEK, Inc.
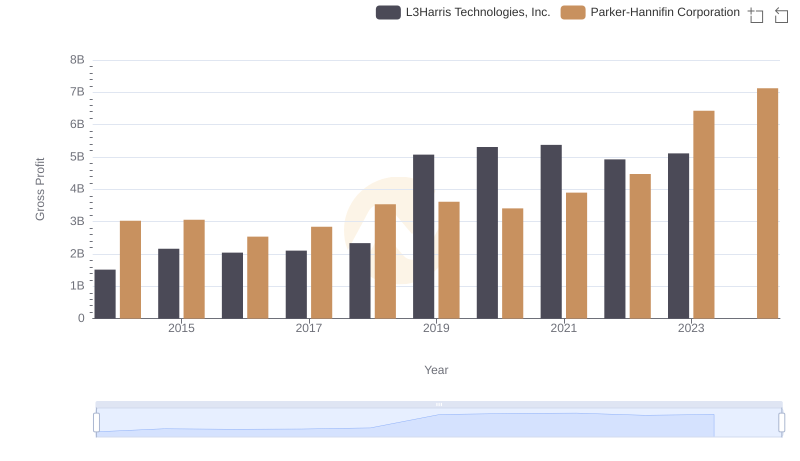
Parker-Hannifin Corporation vs L3Harris Technologies, Inc.: A Gross Profit Performance Breakdown
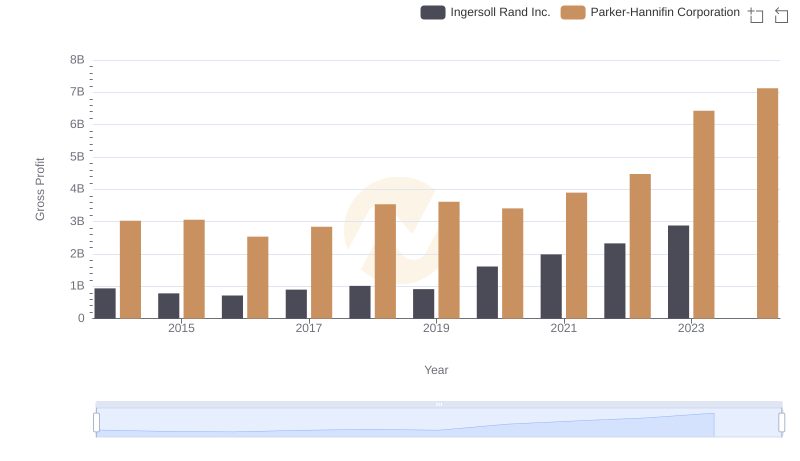
Gross Profit Analysis: Comparing Parker-Hannifin Corporation and Ingersoll Rand Inc.

Cost Management Insights: SG&A Expenses for Parker-Hannifin Corporation and Old Dominion Freight Line, Inc.

Who Generates Higher Gross Profit? Parker-Hannifin Corporation or Westinghouse Air Brake Technologies Corporation
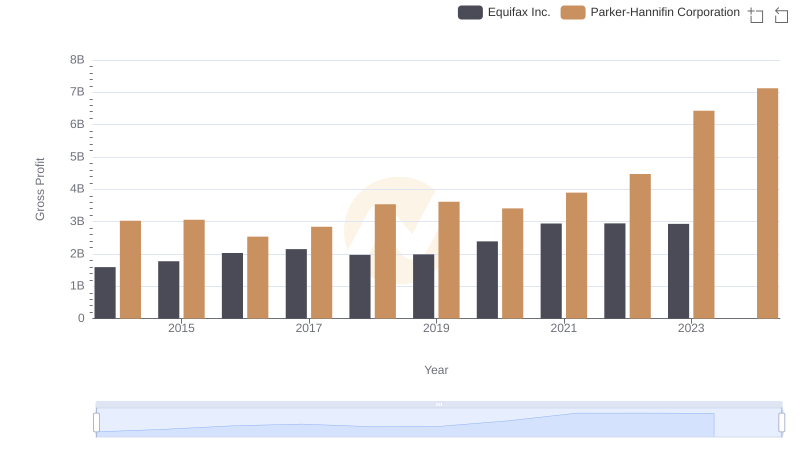
Parker-Hannifin Corporation and Equifax Inc.: A Detailed Gross Profit Analysis