| __timestamp | Global Payments Inc. | Ingersoll Rand Inc. |
|---|---|---|
| Wednesday, January 1, 2014 | 1751611000 | 936781000 |
| Thursday, January 1, 2015 | 1750511000 | 779100000 |
| Friday, January 1, 2016 | 1767444000 | 716731000 |
| Sunday, January 1, 2017 | 2047126000 | 897900000 |
| Monday, January 1, 2018 | 2271352000 | 1012500000 |
| Tuesday, January 1, 2019 | 2838089000 | 911700000 |
| Wednesday, January 1, 2020 | 3772831000 | 1613400000 |
| Friday, January 1, 2021 | 4750037000 | 1988500000 |
| Saturday, January 1, 2022 | 5196898000 | 2325600000 |
| Sunday, January 1, 2023 | 5926898000 | 2882200000 |
| Monday, January 1, 2024 | 6345778000 | 0 |
Unleashing insights
In the ever-evolving landscape of corporate finance, understanding which companies lead in profitability is crucial. Over the past decade, Global Payments Inc. has consistently outperformed Ingersoll Rand Inc. in terms of gross profit. From 2014 to 2023, Global Payments Inc. saw a remarkable growth of over 238%, with gross profits soaring from approximately $1.75 billion to nearly $5.93 billion. In contrast, Ingersoll Rand Inc. experienced a more modest increase of around 207%, with profits rising from about $937 million to $2.88 billion.
This trend highlights Global Payments Inc.'s robust financial strategy and market adaptability, especially in the digital payment sector. Meanwhile, Ingersoll Rand Inc., a stalwart in industrial manufacturing, continues to hold its ground, albeit at a slower pace. As we look to the future, these insights offer a glimpse into the dynamic shifts within these industries.

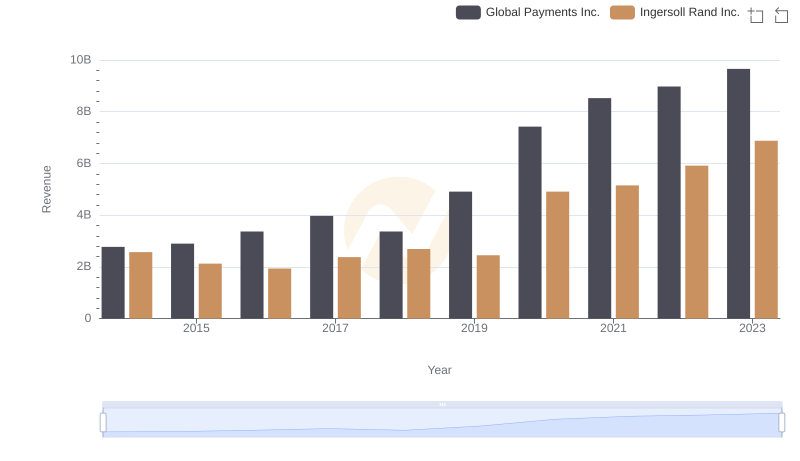
Ingersoll Rand Inc. and Global Payments Inc.: A Comprehensive Revenue Analysis

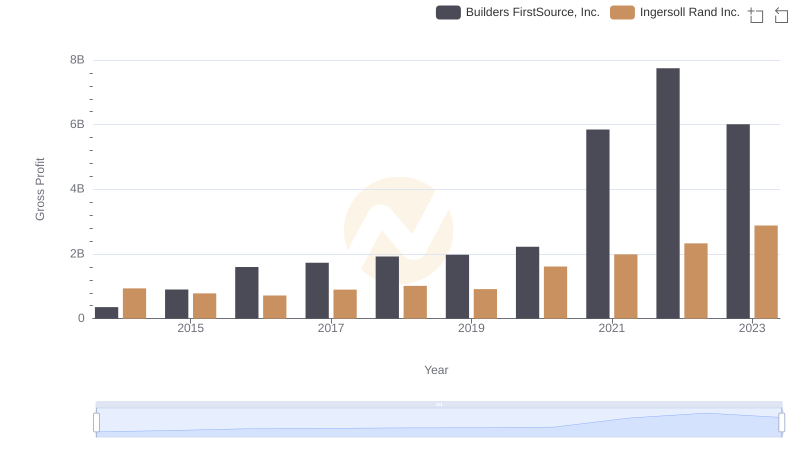
Gross Profit Analysis: Comparing Ingersoll Rand Inc. and Builders FirstSource, Inc.

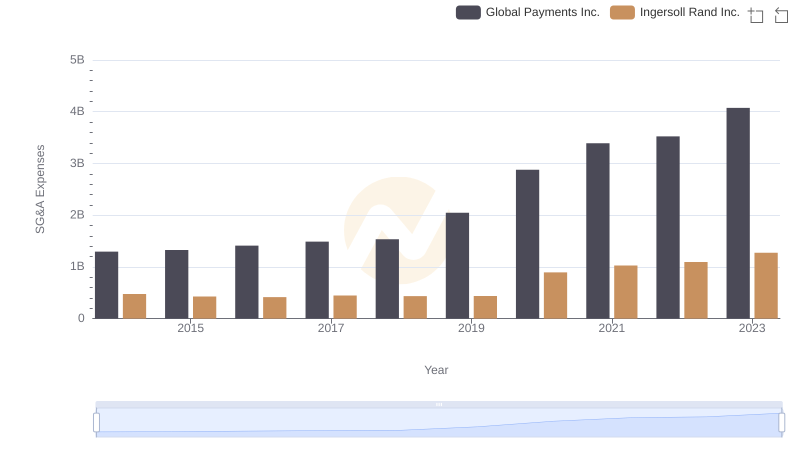
Cost Management Insights: SG&A Expenses for Ingersoll Rand Inc. and Global Payments Inc.

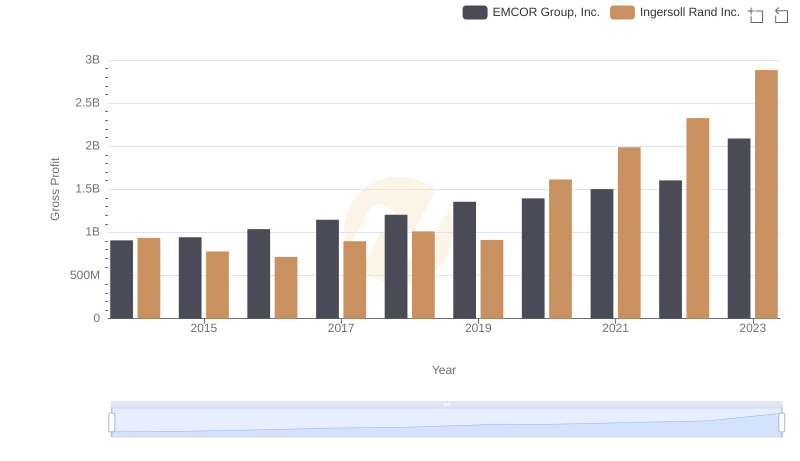
Gross Profit Comparison: Ingersoll Rand Inc. and EMCOR Group, Inc. Trends