| __timestamp | Automatic Data Processing, Inc. | Dover Corporation |
|---|---|---|
| Wednesday, January 1, 2014 | 2616900000 | 1533084000 |
| Thursday, January 1, 2015 | 2355100000 | 1259375000 |
| Friday, January 1, 2016 | 2579500000 | 1186472000 |
| Sunday, January 1, 2017 | 2927200000 | 1304041000 |
| Monday, January 1, 2018 | 2762900000 | 1138930000 |
| Tuesday, January 1, 2019 | 3544500000 | 1241114000 |
| Wednesday, January 1, 2020 | 3769700000 | 1232722000 |
| Friday, January 1, 2021 | 3931600000 | 1797268000 |
| Saturday, January 1, 2022 | 4405500000 | 1711499000 |
| Sunday, January 1, 2023 | 5244600000 | 1718774000 |
| Monday, January 1, 2024 | 5800000000 | 1206355000 |
Unlocking the unknown
In the ever-evolving landscape of corporate finance, EBITDA serves as a crucial indicator of a company's operational efficiency. Over the past decade, Automatic Data Processing, Inc. (ADP) and Dover Corporation have showcased intriguing trajectories in their EBITDA performance. From 2014 to 2023, ADP's EBITDA surged by approximately 122%, reflecting its robust growth strategy and market adaptability. In contrast, Dover Corporation experienced a more modest increase of around 12%, highlighting a steady yet less aggressive expansion.
ADP's remarkable growth, particularly between 2022 and 2023, where EBITDA jumped by 19%, underscores its strategic initiatives and market positioning. Meanwhile, Dover's consistent performance, despite a slight dip in 2018, indicates resilience in a competitive market. Notably, data for 2024 is incomplete, suggesting potential developments on the horizon. This analysis offers a window into the financial health and strategic direction of these industry giants.

Gross Profit Comparison: Automatic Data Processing, Inc. and Dover Corporation Trends
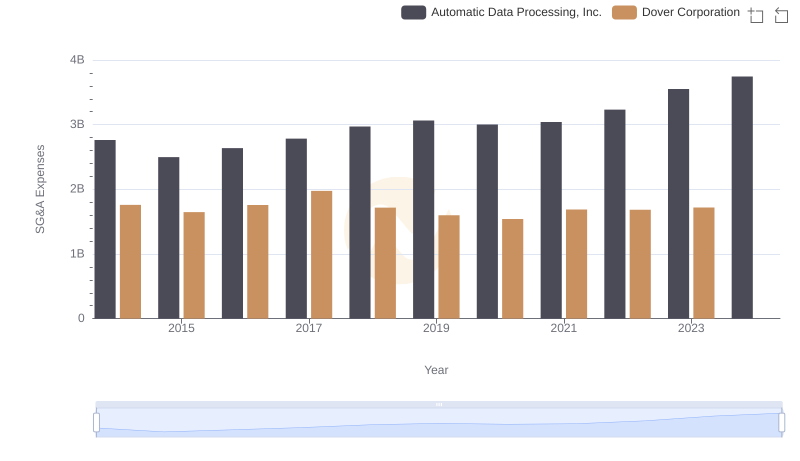
Automatic Data Processing, Inc. and Dover Corporation: SG&A Spending Patterns Compared
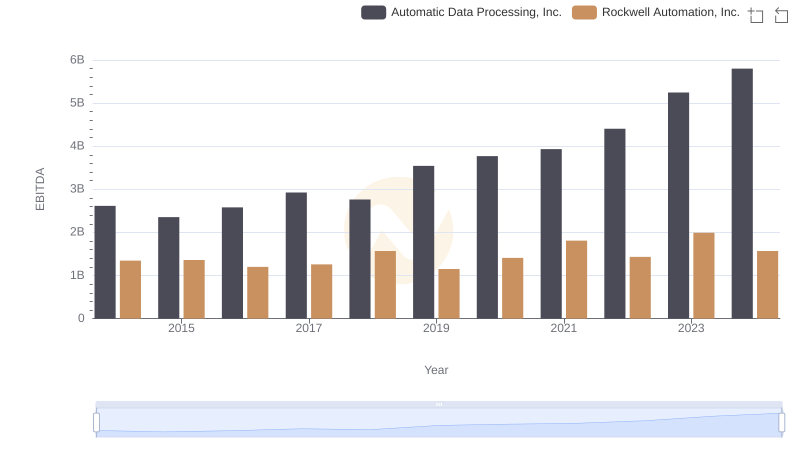
Automatic Data Processing, Inc. and Rockwell Automation, Inc.: A Detailed Examination of EBITDA Performance
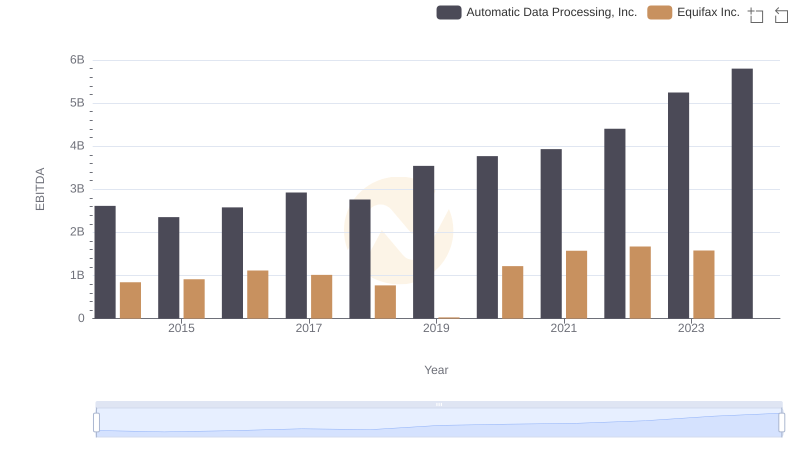
EBITDA Performance Review: Automatic Data Processing, Inc. vs Equifax Inc.

Automatic Data Processing, Inc. vs HEICO Corporation: In-Depth EBITDA Performance Comparison