| __timestamp | Emerson Electric Co. | Union Pacific Corporation |
|---|---|---|
| Wednesday, January 1, 2014 | 10158000000 | 9677000000 |
| Thursday, January 1, 2015 | 9048000000 | 8976000000 |
| Friday, January 1, 2016 | 6262000000 | 8269000000 |
| Sunday, January 1, 2017 | 6404000000 | 9009000000 |
| Monday, January 1, 2018 | 7460000000 | 9539000000 |
| Tuesday, January 1, 2019 | 7815000000 | 9614000000 |
| Wednesday, January 1, 2020 | 7009000000 | 9179000000 |
| Friday, January 1, 2021 | 7563000000 | 10514000000 |
| Saturday, January 1, 2022 | 8188000000 | 11205000000 |
| Sunday, January 1, 2023 | 7427000000 | 10529000000 |
| Monday, January 1, 2024 | 7808000000 | 11039000000 |
Unveiling the hidden dimensions of data
In the ever-evolving landscape of American industry, Union Pacific Corporation and Emerson Electric Co. stand as titans of their respective fields. Over the past decade, these companies have demonstrated resilience and adaptability, as reflected in their gross profit trends from 2014 to 2024.
Union Pacific, a leader in the transportation sector, has seen a steady increase in gross profit, peaking in 2022 with a remarkable 15% growth compared to 2014. This growth underscores the company's strategic investments in infrastructure and technology.
Conversely, Emerson Electric, a stalwart in the manufacturing industry, experienced fluctuations, with a notable dip in 2016. However, by 2024, Emerson's gross profit rebounded to nearly 77% of its 2014 peak, highlighting its ability to navigate economic challenges and innovate.
These trends offer a fascinating glimpse into the dynamic interplay of market forces and corporate strategy, providing valuable insights for investors and industry analysts alike.
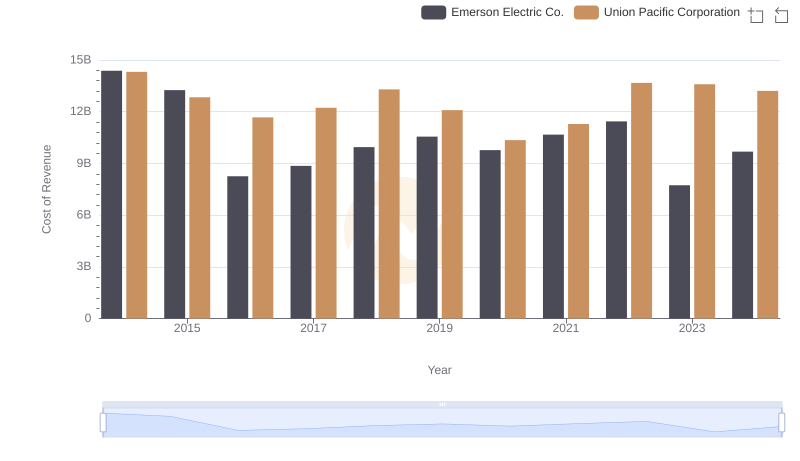
Cost of Revenue Trends: Union Pacific Corporation vs Emerson Electric Co.
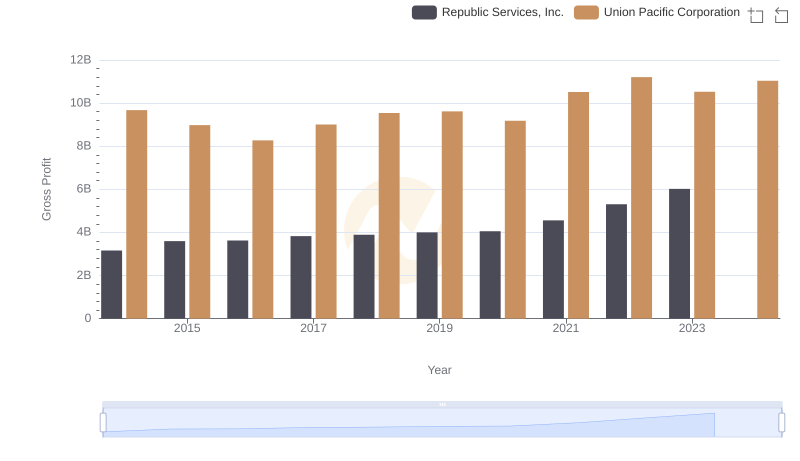
Who Generates Higher Gross Profit? Union Pacific Corporation or Republic Services, Inc.
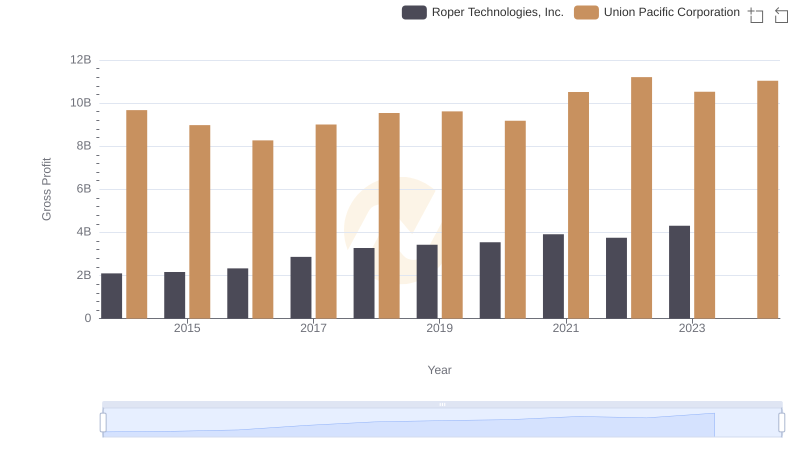
Who Generates Higher Gross Profit? Union Pacific Corporation or Roper Technologies, Inc.
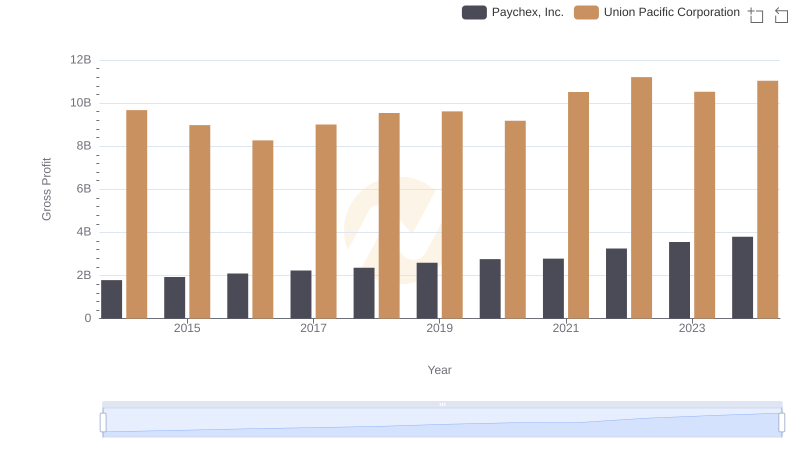
Gross Profit Analysis: Comparing Union Pacific Corporation and Paychex, Inc.