| __timestamp | TFI International Inc. | Trane Technologies plc |
|---|---|---|
| Wednesday, January 1, 2014 | 417323364 | 3908600000 |
| Thursday, January 1, 2015 | 352552803 | 3999100000 |
| Friday, January 1, 2016 | 358230042 | 4179600000 |
| Sunday, January 1, 2017 | 405214314 | 4386000000 |
| Monday, January 1, 2018 | 510006388 | 4820600000 |
| Tuesday, January 1, 2019 | 502631921 | 5147400000 |
| Wednesday, January 1, 2020 | 541885000 | 3803400000 |
| Friday, January 1, 2021 | 1037863000 | 4469600000 |
| Saturday, January 1, 2022 | 1426851000 | 4964800000 |
| Sunday, January 1, 2023 | 1265392000 | 5857200000 |
| Monday, January 1, 2024 | 7080500000 |
Igniting the spark of knowledge
In the ever-evolving landscape of industrial giants, Trane Technologies plc and TFI International Inc. have carved distinct paths in their financial journeys. Over the past decade, from 2014 to 2023, these companies have showcased remarkable growth in gross profit, albeit at different scales. Trane Technologies, a leader in climate innovation, consistently outperformed with an average gross profit nearly six times that of TFI International, a logistics powerhouse. Notably, Trane Technologies saw a 50% increase in gross profit from 2014 to 2023, peaking in 2023 with a staggering 5.86 billion. Meanwhile, TFI International demonstrated resilience, achieving a 260% growth over the same period, reaching 1.27 billion in 2023. This performance breakdown not only highlights their financial prowess but also underscores the diverse strategies employed by these industry titans to navigate economic challenges and capitalize on opportunities.
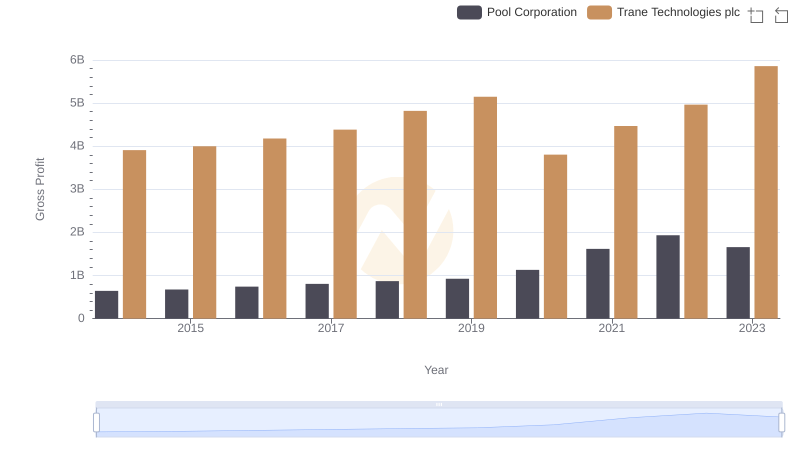
Gross Profit Analysis: Comparing Trane Technologies plc and Pool Corporation
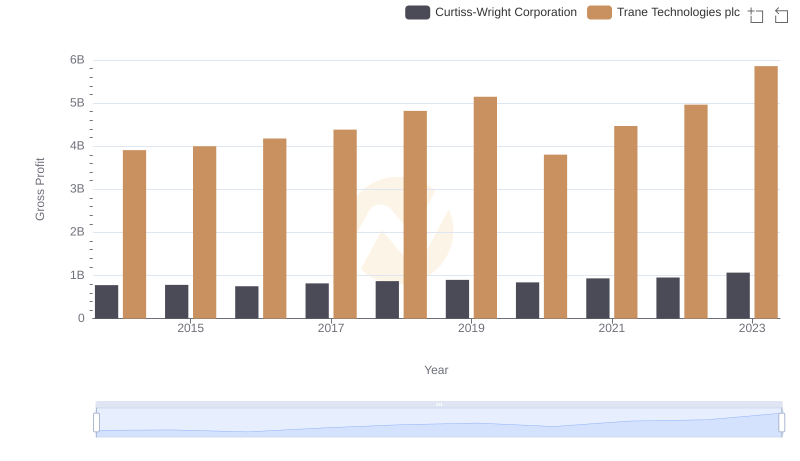
Who Generates Higher Gross Profit? Trane Technologies plc or Curtiss-Wright Corporation
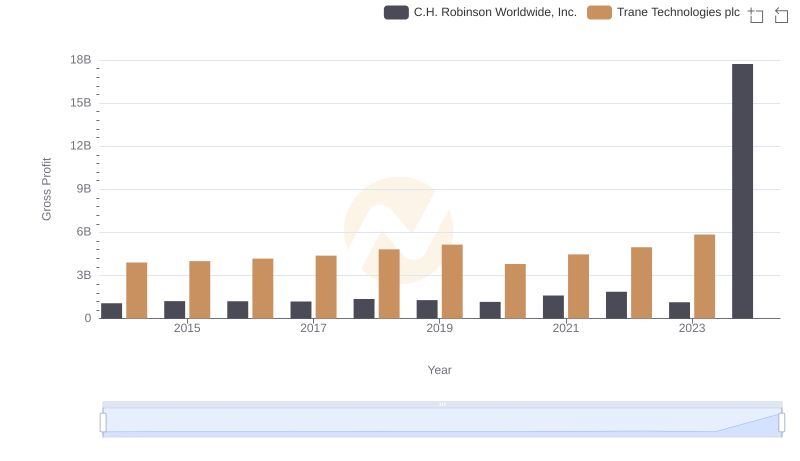
Who Generates Higher Gross Profit? Trane Technologies plc or C.H. Robinson Worldwide, Inc.
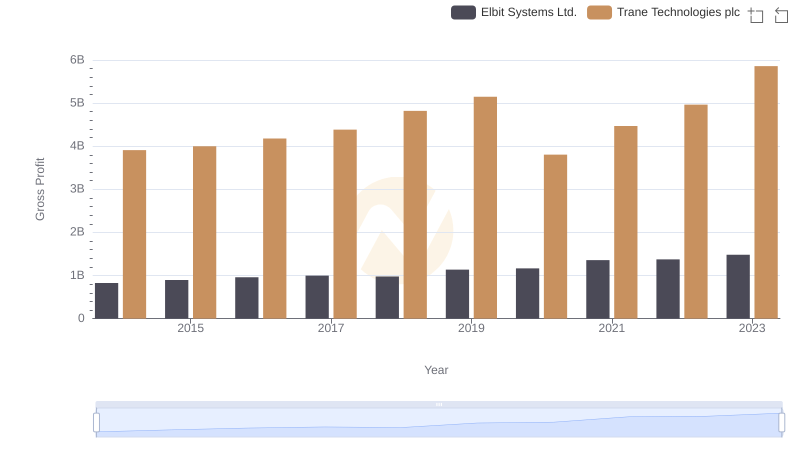
Key Insights on Gross Profit: Trane Technologies plc vs Elbit Systems Ltd.

Trane Technologies plc vs TFI International Inc.: Examining Key Revenue Metrics
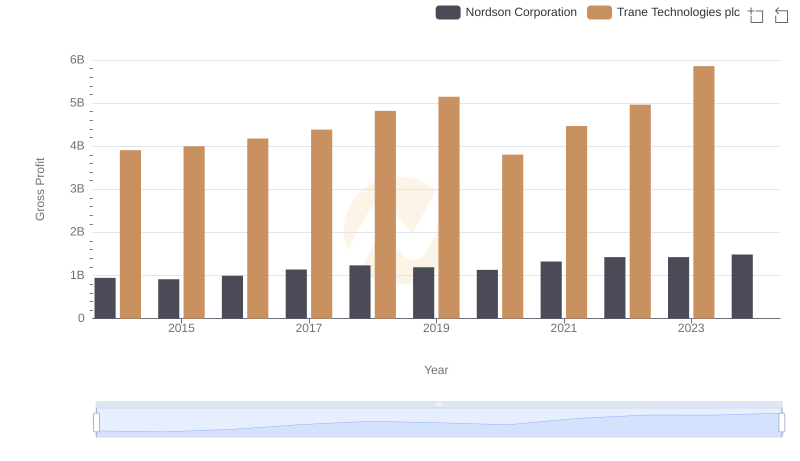
Key Insights on Gross Profit: Trane Technologies plc vs Nordson Corporation
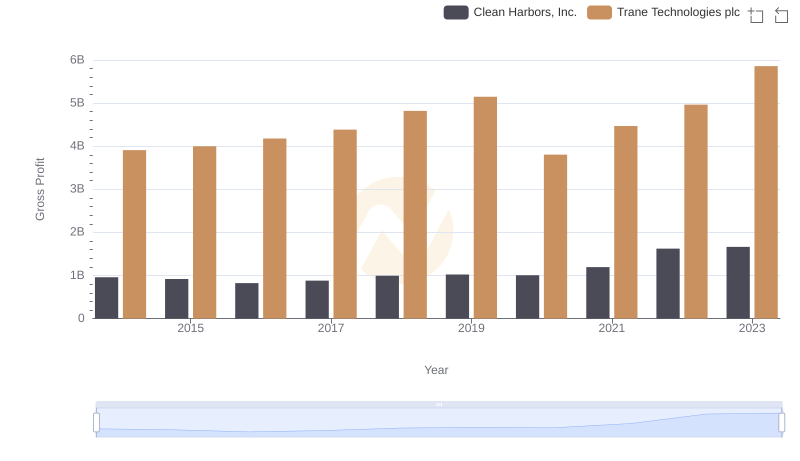
Key Insights on Gross Profit: Trane Technologies plc vs Clean Harbors, Inc.
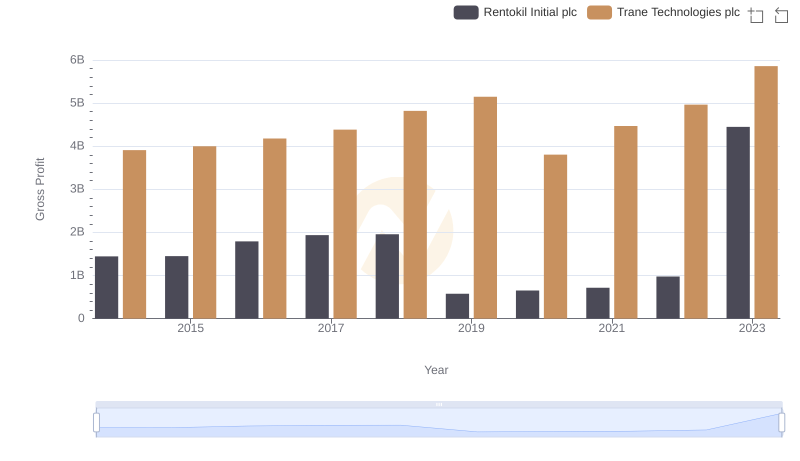
Gross Profit Comparison: Trane Technologies plc and Rentokil Initial plc Trends
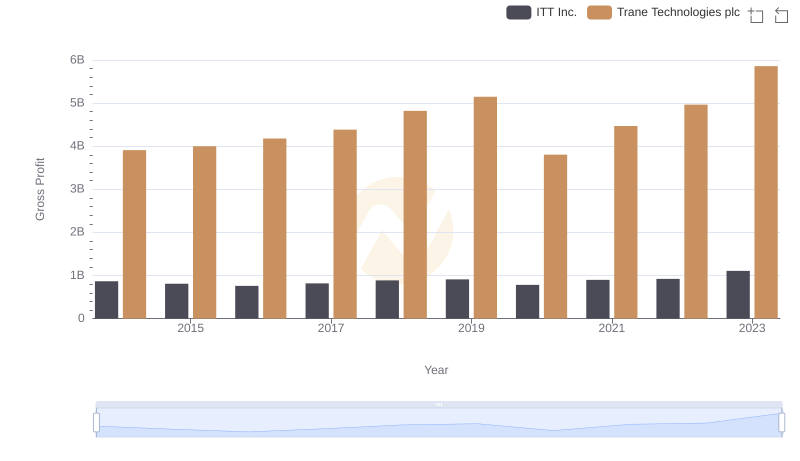
Gross Profit Analysis: Comparing Trane Technologies plc and ITT Inc.
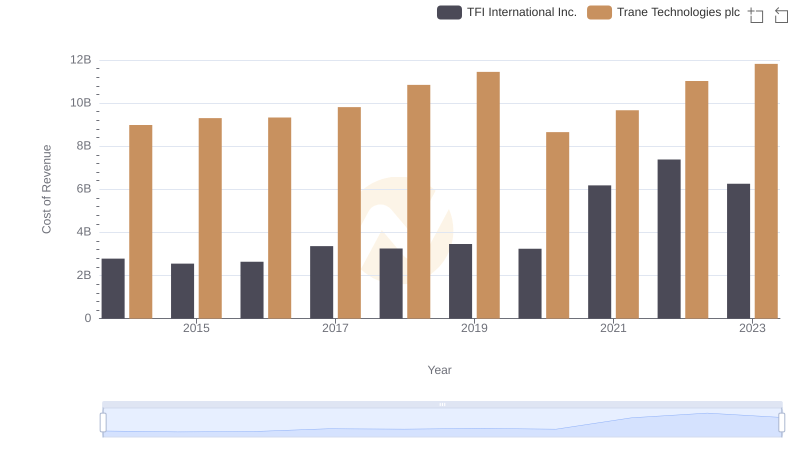
Trane Technologies plc vs TFI International Inc.: Efficiency in Cost of Revenue Explored
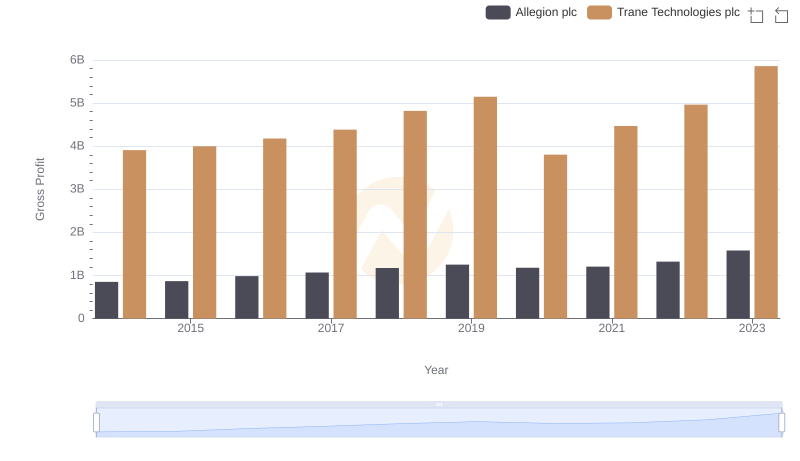
Gross Profit Analysis: Comparing Trane Technologies plc and Allegion plc
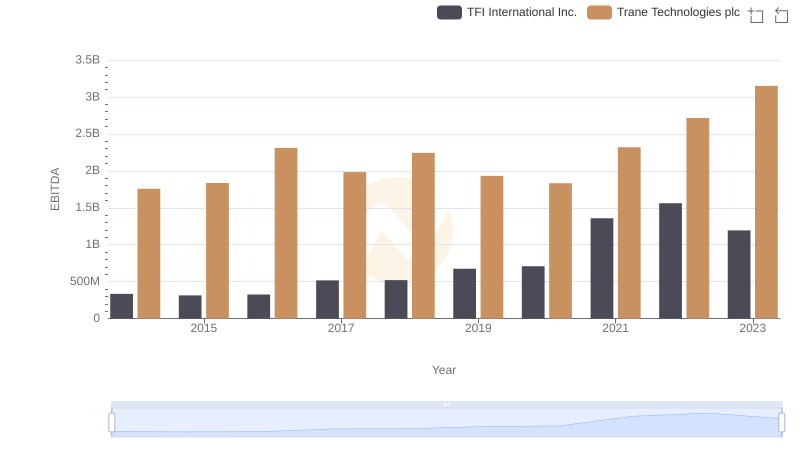
Comprehensive EBITDA Comparison: Trane Technologies plc vs TFI International Inc.