| __timestamp | Infosys Limited | Ubiquiti Inc. |
|---|---|---|
| Wednesday, January 1, 2014 | 3337000000 | 253467000 |
| Thursday, January 1, 2015 | 3551000000 | 262187000 |
| Friday, January 1, 2016 | 3762000000 | 324795000 |
| Sunday, January 1, 2017 | 3938000000 | 395708000 |
| Monday, January 1, 2018 | 4112000000 | 443572000 |
| Tuesday, January 1, 2019 | 4228000000 | 537604000 |
| Wednesday, January 1, 2020 | 4733000000 | 608172000 |
| Friday, January 1, 2021 | 5315000000 | 912276000 |
| Saturday, January 1, 2022 | 5503000000 | 669812000 |
| Sunday, January 1, 2023 | 5466000000 | 760731000 |
| Monday, January 1, 2024 | 739762000 |
Infusing magic into the data realm
In the ever-evolving landscape of global technology, understanding financial performance is crucial. This analysis delves into the gross profit trends of two industry giants: Infosys Limited and Ubiquiti Inc., from 2014 to 2023.
Infosys Limited, a leader in IT services, has shown a consistent upward trajectory in gross profit over the past decade. Starting at approximately $3.3 billion in 2014, Infosys saw a remarkable 65% increase, peaking at $5.5 billion in 2022. This growth underscores Infosys's robust business model and strategic market positioning.
Ubiquiti Inc., known for its innovative networking technology, experienced a more volatile yet impressive growth. From $253 million in 2014, Ubiquiti's gross profit surged by over 260%, reaching $912 million in 2021. Despite a slight dip in 2023, Ubiquiti's growth narrative remains compelling.
Both companies exemplify resilience and adaptability in a competitive market, with Infosys's steady growth contrasting Ubiquiti's dynamic expansion.
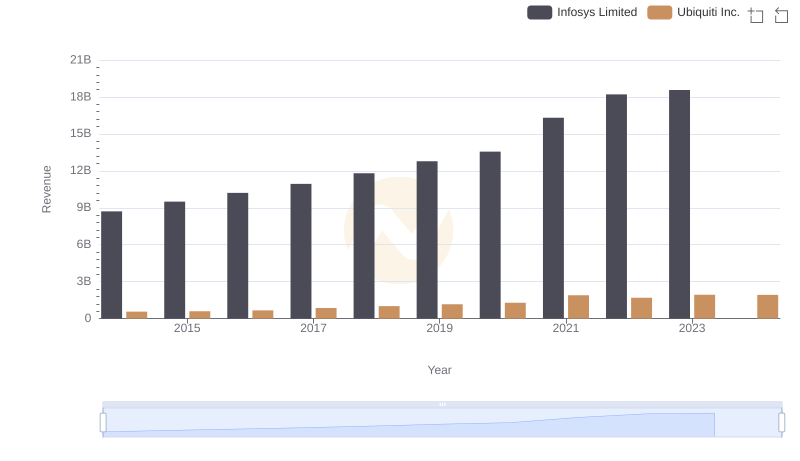
Annual Revenue Comparison: Infosys Limited vs Ubiquiti Inc.
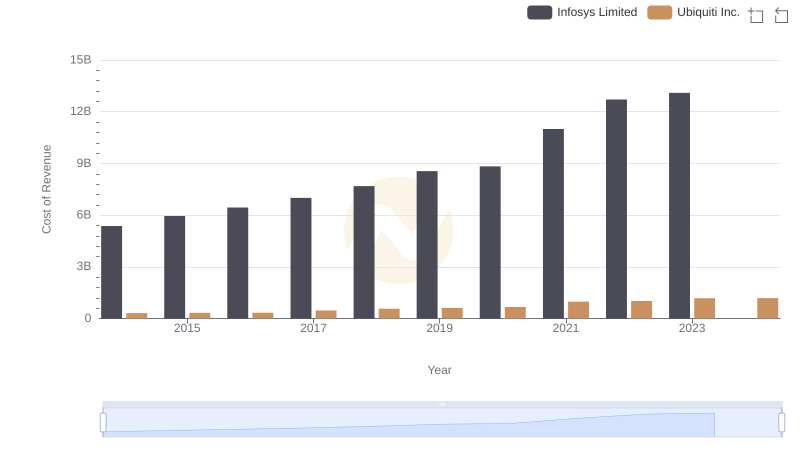
Analyzing Cost of Revenue: Infosys Limited and Ubiquiti Inc.

Infosys Limited vs PTC Inc.: A Gross Profit Performance Breakdown
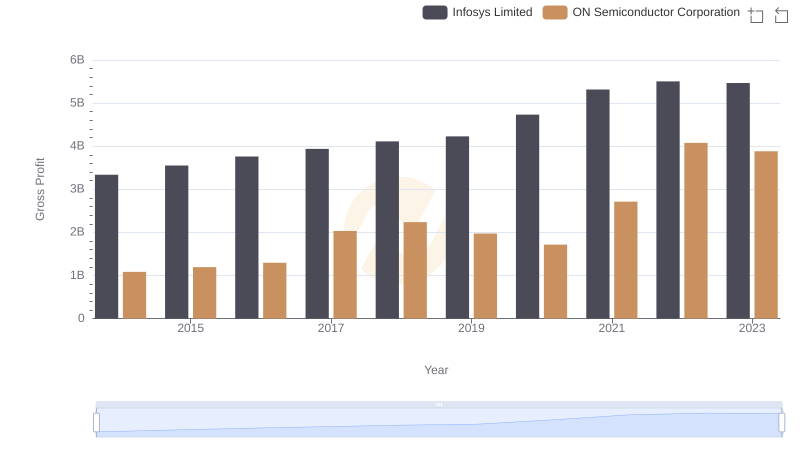
Gross Profit Trends Compared: Infosys Limited vs ON Semiconductor Corporation
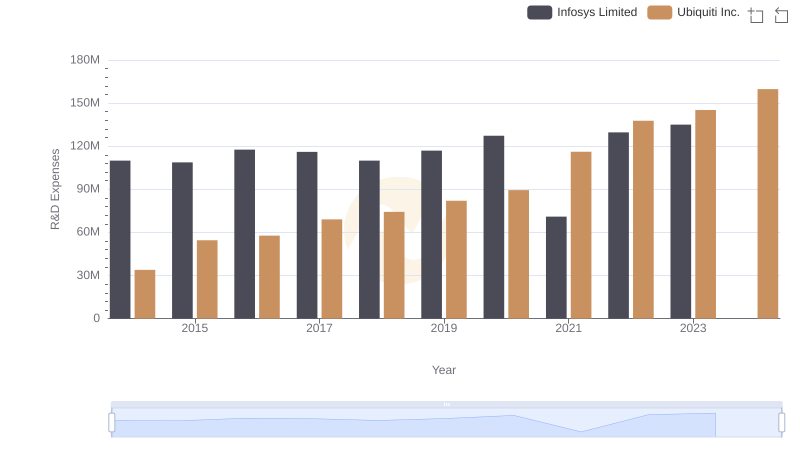
Research and Development Expenses Breakdown: Infosys Limited vs Ubiquiti Inc.
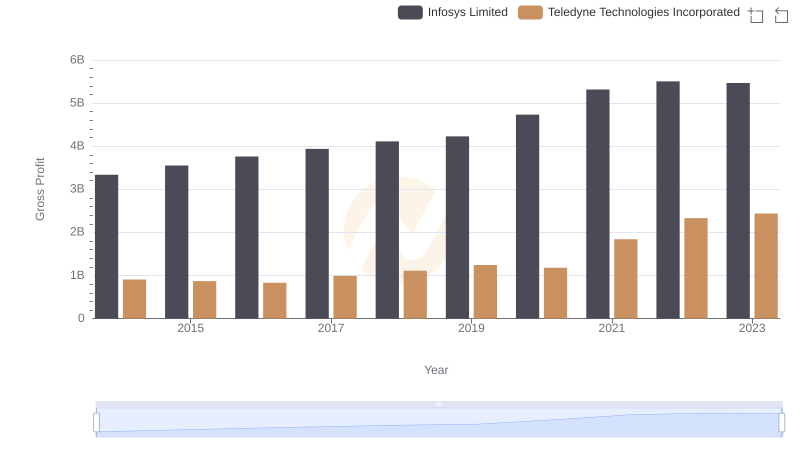
Gross Profit Comparison: Infosys Limited and Teledyne Technologies Incorporated Trends
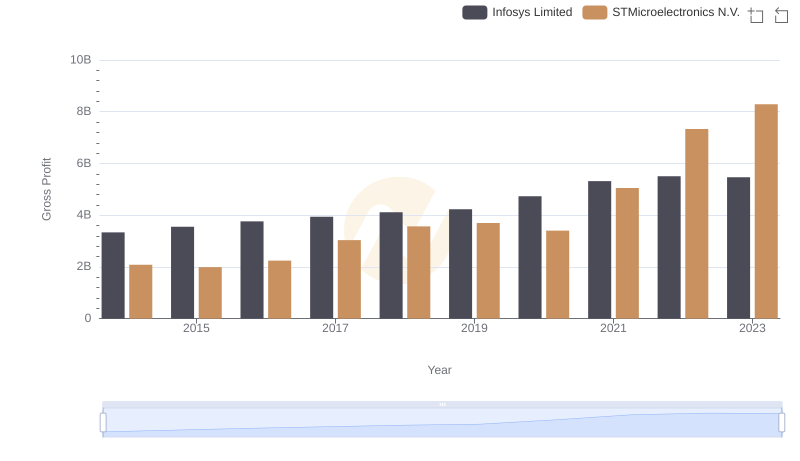
Infosys Limited and STMicroelectronics N.V.: A Detailed Gross Profit Analysis
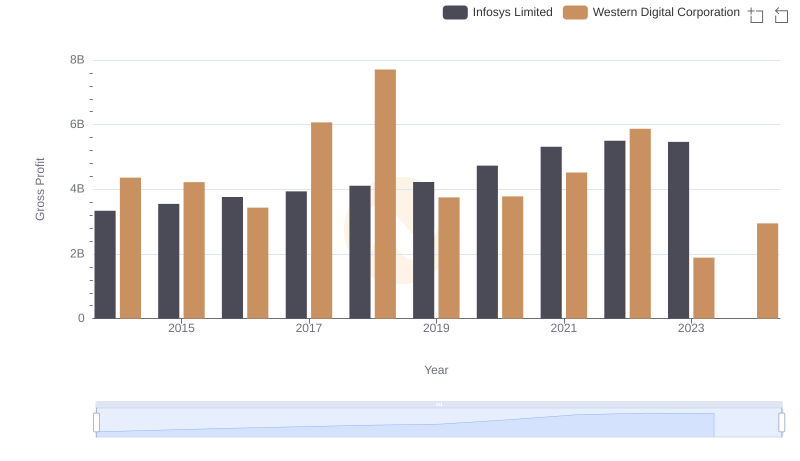
Infosys Limited and Western Digital Corporation: A Detailed Gross Profit Analysis
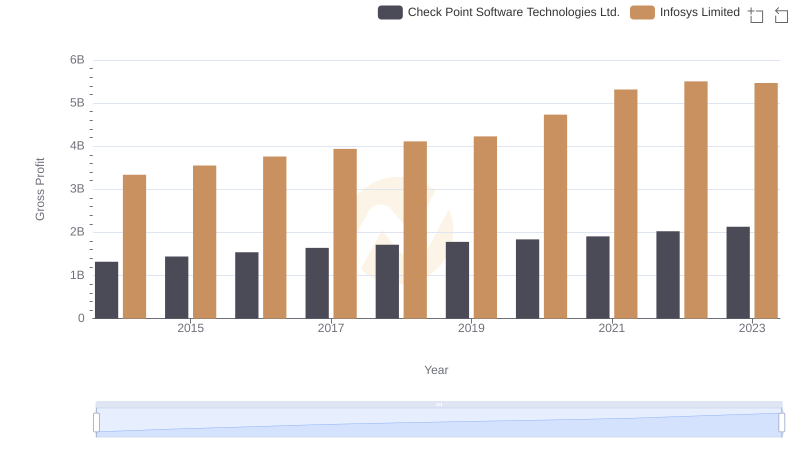
Infosys Limited vs Check Point Software Technologies Ltd.: A Gross Profit Performance Breakdown
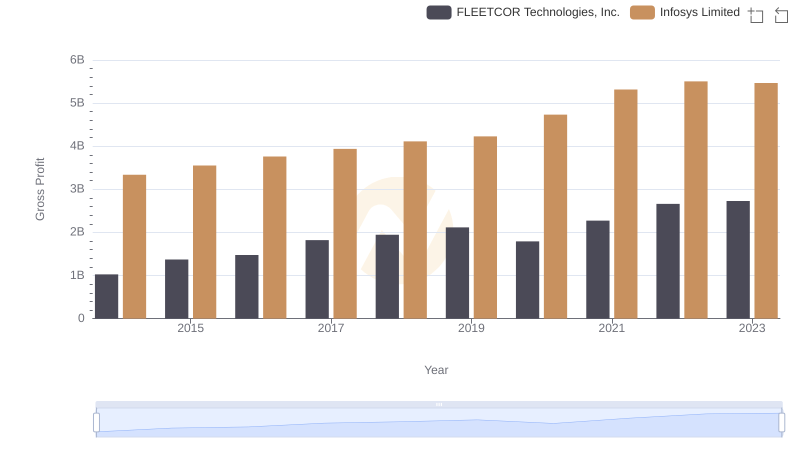
Infosys Limited and FLEETCOR Technologies, Inc.: A Detailed Gross Profit Analysis
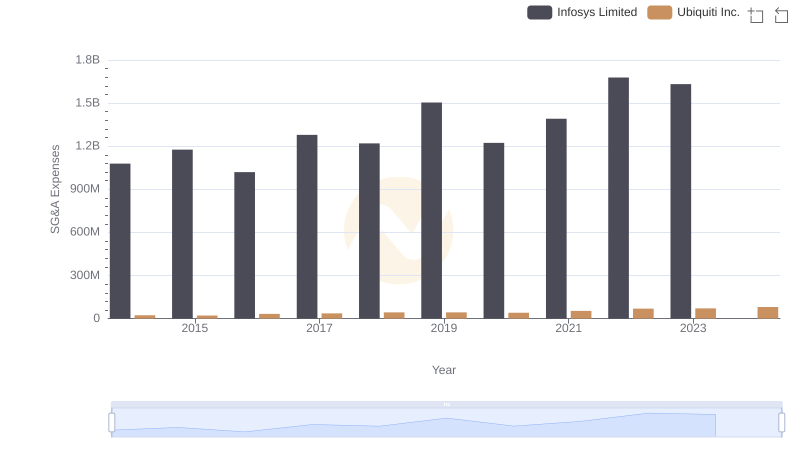
Operational Costs Compared: SG&A Analysis of Infosys Limited and Ubiquiti Inc.
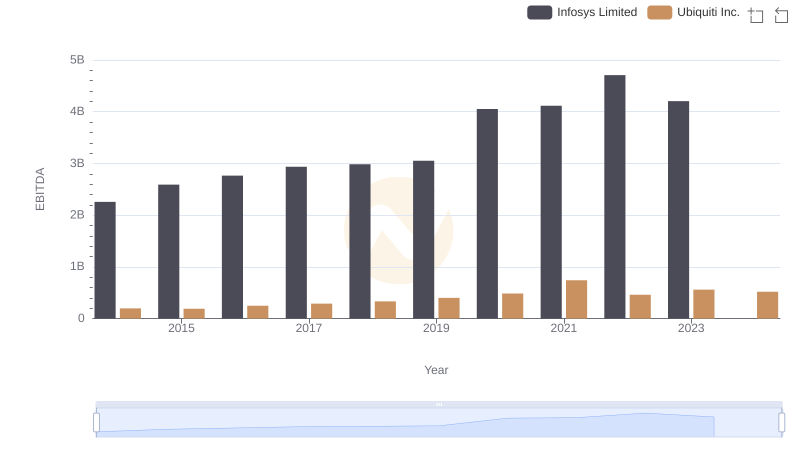
A Professional Review of EBITDA: Infosys Limited Compared to Ubiquiti Inc.