| __timestamp | Avery Dennison Corporation | Equifax Inc. |
|---|---|---|
| Wednesday, January 1, 2014 | 1155300000 | 751700000 |
| Thursday, January 1, 2015 | 1108100000 | 884300000 |
| Friday, January 1, 2016 | 1097500000 | 948200000 |
| Sunday, January 1, 2017 | 1123200000 | 1039100000 |
| Monday, January 1, 2018 | 1127500000 | 1213300000 |
| Tuesday, January 1, 2019 | 1080400000 | 1990200000 |
| Wednesday, January 1, 2020 | 1060500000 | 1322500000 |
| Friday, January 1, 2021 | 1248500000 | 1324600000 |
| Saturday, January 1, 2022 | 1330800000 | 1328900000 |
| Sunday, January 1, 2023 | 1177900000 | 1385700000 |
| Monday, January 1, 2024 | 1415300000 | 1450500000 |
Data in motion
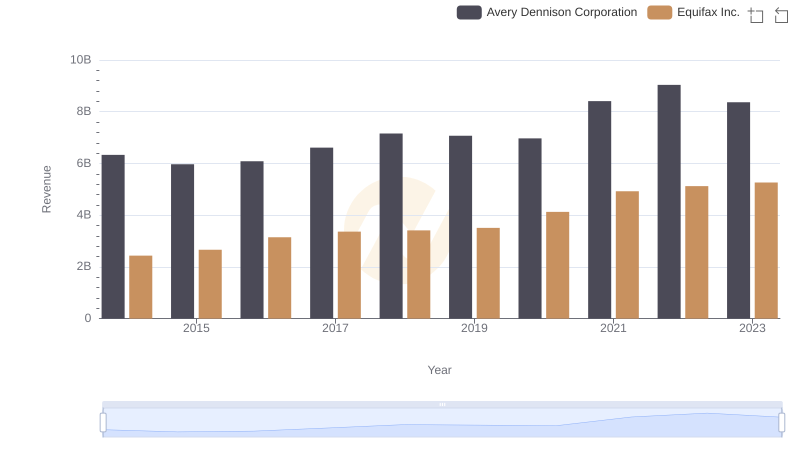
In the ever-evolving landscape of corporate finance, understanding the nuances of Selling, General, and Administrative (SG&A) expenses is crucial. Over the past decade, Equifax Inc. and Avery Dennison Corporation have showcased distinct trends in their SG&A expenditures. From 2014 to 2023, Equifax's SG&A expenses surged by approximately 84%, peaking in 2019. In contrast, Avery Dennison's expenses remained relatively stable, with a modest increase of around 15% over the same period. Notably, 2022 marked a pivotal year where both companies reported nearly identical SG&A expenses, highlighting a convergence in their financial strategies. This analysis underscores the importance of strategic financial management in maintaining competitive advantage and operational efficiency. As businesses navigate the complexities of the modern economy, these insights offer valuable lessons in cost management and resource allocation.