| __timestamp | Union Pacific Corporation | Waste Management, Inc. |
|---|---|---|
| Wednesday, January 1, 2014 | 10808000000 | 3509000000 |
| Thursday, January 1, 2015 | 10290000000 | 3342000000 |
| Friday, January 1, 2016 | 9502000000 | 3713000000 |
| Sunday, January 1, 2017 | 10456000000 | 3996000000 |
| Monday, January 1, 2018 | 10802000000 | 4212000000 |
| Tuesday, January 1, 2019 | 11013000000 | 4344000000 |
| Wednesday, January 1, 2020 | 10331000000 | 4149000000 |
| Friday, January 1, 2021 | 11843000000 | 4956000000 |
| Saturday, January 1, 2022 | 12636000000 | 5466000000 |
| Sunday, January 1, 2023 | 11928000000 | 5592000000 |
| Monday, January 1, 2024 | 12461000000 | 5128000000 |
In pursuit of knowledge
In the world of industrial titans, Union Pacific Corporation and Waste Management, Inc. stand as pillars of their respective sectors. Over the past decade, Union Pacific has consistently outperformed Waste Management in terms of EBITDA, showcasing its robust operational efficiency. From 2014 to 2023, Union Pacific's EBITDA grew by approximately 15%, peaking in 2022. In contrast, Waste Management saw a steady rise of around 59% during the same period, reflecting its strategic expansions and operational improvements.
As we look to the future, these trends offer a fascinating glimpse into the evolving dynamics of these industry leaders.

Who Generates Higher Gross Profit? Union Pacific Corporation or Waste Management, Inc.
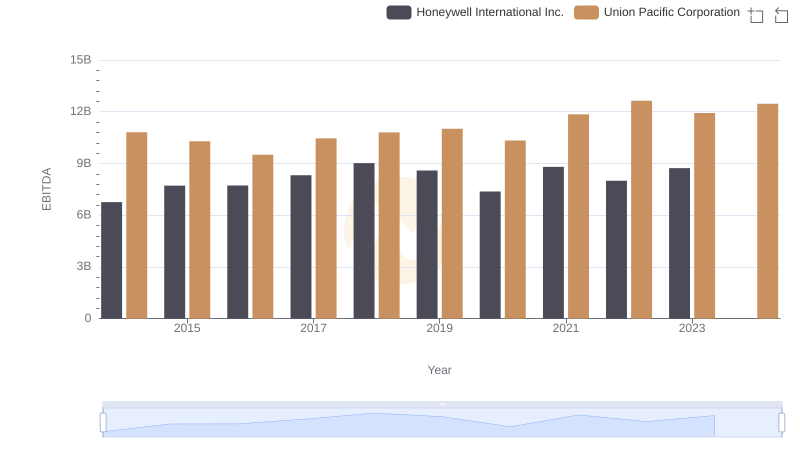
EBITDA Metrics Evaluated: Union Pacific Corporation vs Honeywell International Inc.
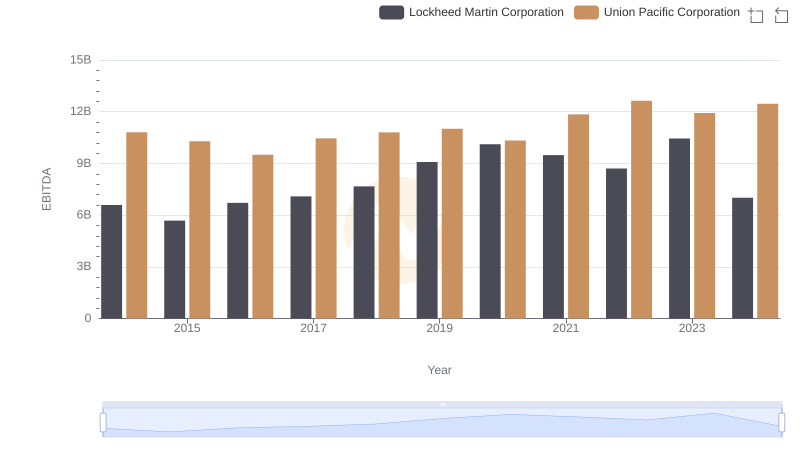
Comparative EBITDA Analysis: Union Pacific Corporation vs Lockheed Martin Corporation

EBITDA Performance Review: Union Pacific Corporation vs Deere & Company
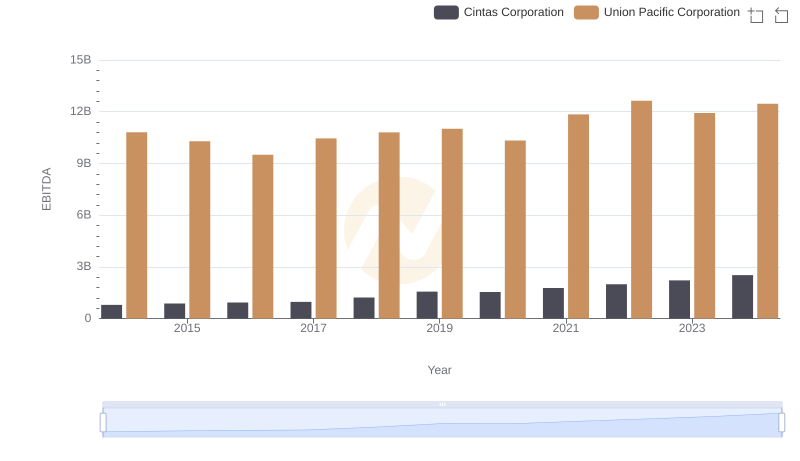
A Side-by-Side Analysis of EBITDA: Union Pacific Corporation and Cintas Corporation
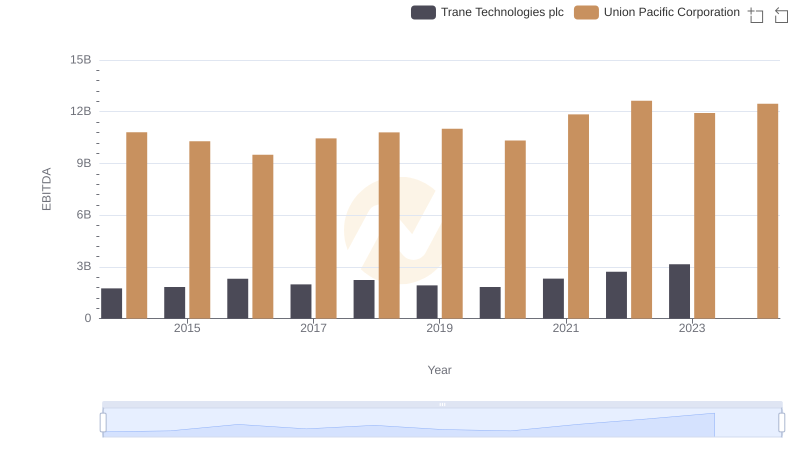
Comparative EBITDA Analysis: Union Pacific Corporation vs Trane Technologies plc