| __timestamp | International Business Machines Corporation | NetApp, Inc. |
|---|---|---|
| Wednesday, January 1, 2014 | 92793000000 | 6325100000 |
| Thursday, January 1, 2015 | 81742000000 | 6122700000 |
| Friday, January 1, 2016 | 79920000000 | 5546000000 |
| Sunday, January 1, 2017 | 79139000000 | 5519000000 |
| Monday, January 1, 2018 | 79591000000 | 5911000000 |
| Tuesday, January 1, 2019 | 57714000000 | 6146000000 |
| Wednesday, January 1, 2020 | 55179000000 | 5412000000 |
| Friday, January 1, 2021 | 57351000000 | 5744000000 |
| Saturday, January 1, 2022 | 60530000000 | 6318000000 |
| Sunday, January 1, 2023 | 61860000000 | 6362000000 |
| Monday, January 1, 2024 | 62753000000 | 6268000000 |
Unlocking the unknown
In the ever-evolving tech industry, revenue performance is a key indicator of a company's market position and growth potential. Over the past decade, International Business Machines Corporation (IBM) and NetApp, Inc. have showcased contrasting revenue trajectories. IBM, a stalwart in the tech world, saw its revenue peak in 2014, only to experience a gradual decline of approximately 32% by 2021. However, recent years have shown a slight recovery, with a 9% increase from 2021 to 2024.
Conversely, NetApp, a leader in data management solutions, maintained a more stable revenue stream. Despite minor fluctuations, NetApp's revenue remained relatively consistent, with a modest 1% increase from 2014 to 2024. This stability highlights NetApp's resilience in a competitive market. As we look to the future, these trends offer valuable insights into the strategic directions and market adaptability of these tech giants.
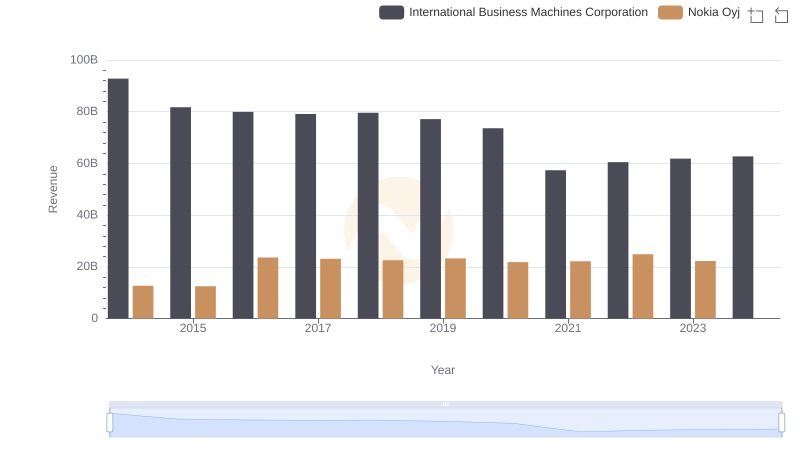
International Business Machines Corporation or Nokia Oyj: Who Leads in Yearly Revenue?
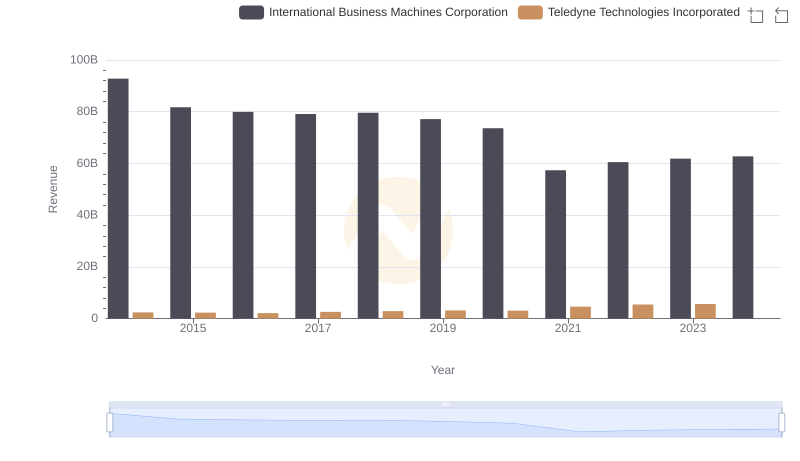
Revenue Insights: International Business Machines Corporation and Teledyne Technologies Incorporated Performance Compared
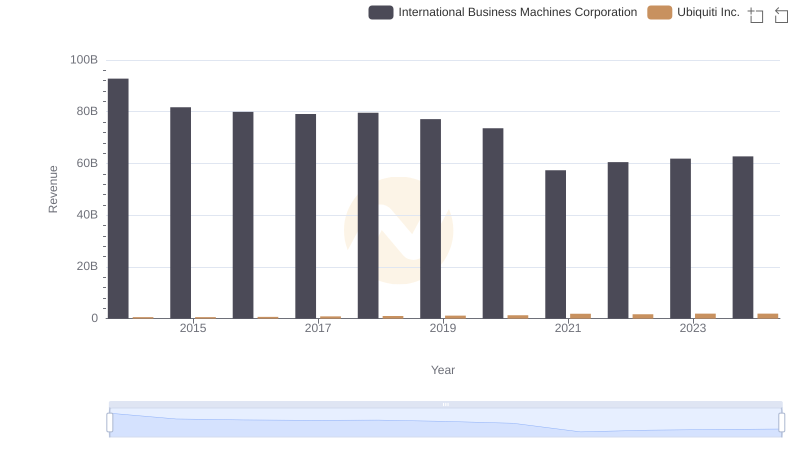
Breaking Down Revenue Trends: International Business Machines Corporation vs Ubiquiti Inc.

Who Generates More Revenue? International Business Machines Corporation or ON Semiconductor Corporation
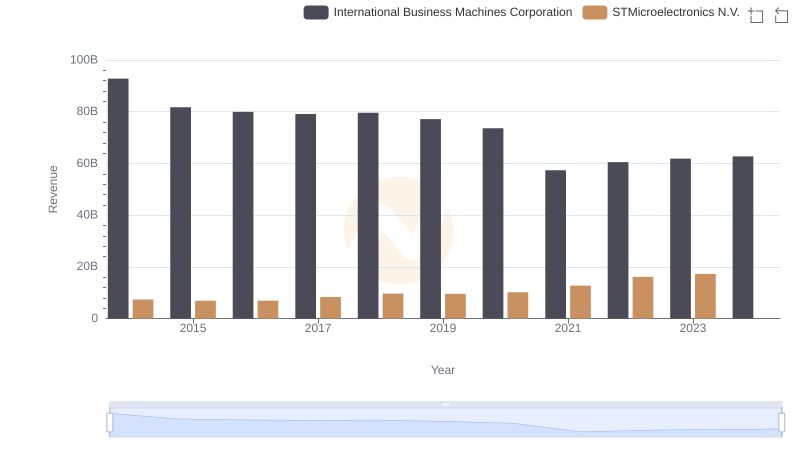
Who Generates More Revenue? International Business Machines Corporation or STMicroelectronics N.V.

International Business Machines Corporation and PTC Inc.: A Comprehensive Revenue Analysis
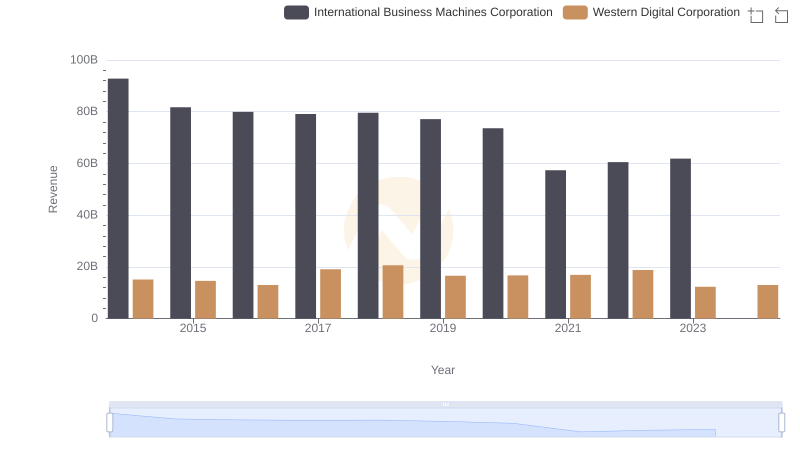
International Business Machines Corporation and Western Digital Corporation: A Comprehensive Revenue Analysis
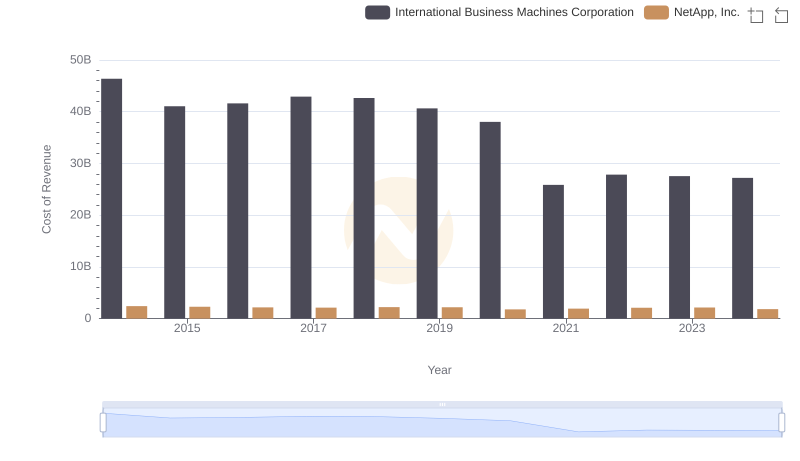
Analyzing Cost of Revenue: International Business Machines Corporation and NetApp, Inc.

Gross Profit Trends Compared: International Business Machines Corporation vs NetApp, Inc.
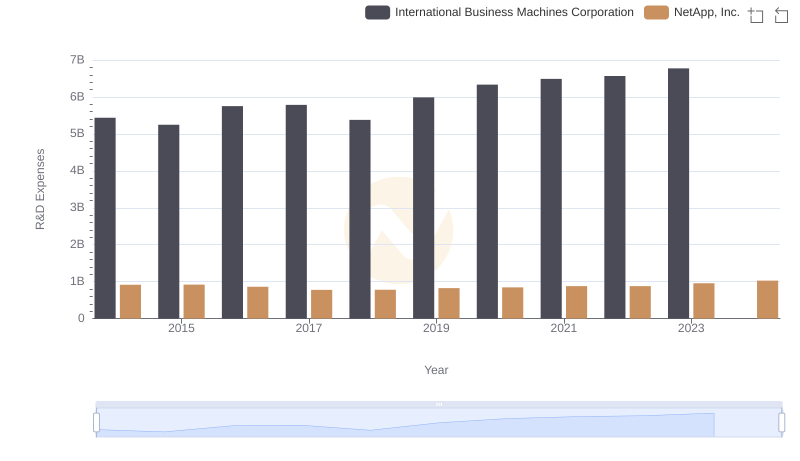
R&D Spending Showdown: International Business Machines Corporation vs NetApp, Inc.
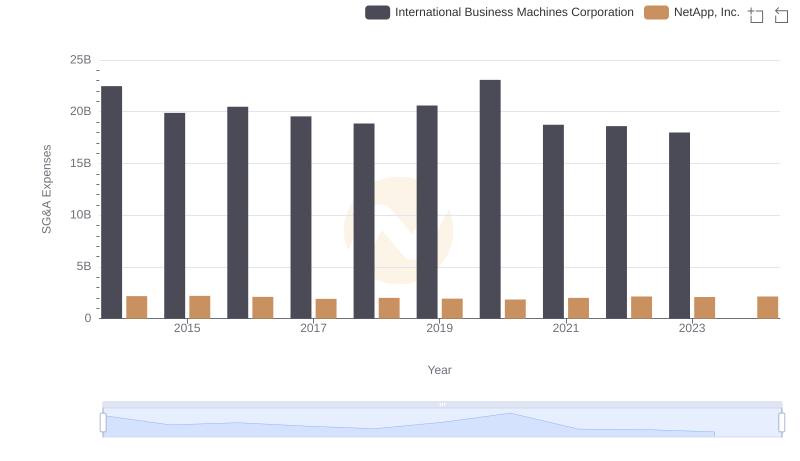
Who Optimizes SG&A Costs Better? International Business Machines Corporation or NetApp, Inc.
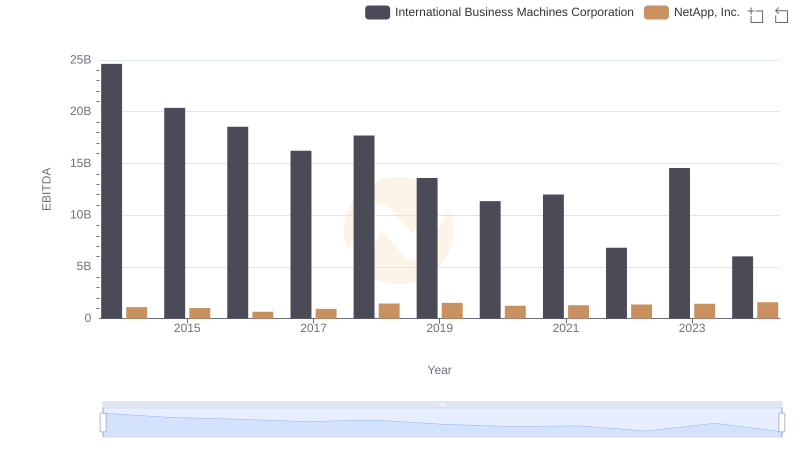
EBITDA Performance Review: International Business Machines Corporation vs NetApp, Inc.