| __timestamp | Honeywell International Inc. | Union Pacific Corporation |
|---|---|---|
| Wednesday, January 1, 2014 | 6755000000 | 10808000000 |
| Thursday, January 1, 2015 | 7711000000 | 10290000000 |
| Friday, January 1, 2016 | 7718000000 | 9502000000 |
| Sunday, January 1, 2017 | 8314000000 | 10456000000 |
| Monday, January 1, 2018 | 9018000000 | 10802000000 |
| Tuesday, January 1, 2019 | 8592000000 | 11013000000 |
| Wednesday, January 1, 2020 | 7373000000 | 10331000000 |
| Friday, January 1, 2021 | 8801000000 | 11843000000 |
| Saturday, January 1, 2022 | 7997000000 | 12636000000 |
| Sunday, January 1, 2023 | 8730000000 | 11928000000 |
| Monday, January 1, 2024 | 7213000000 | 12461000000 |
Unveiling the hidden dimensions of data
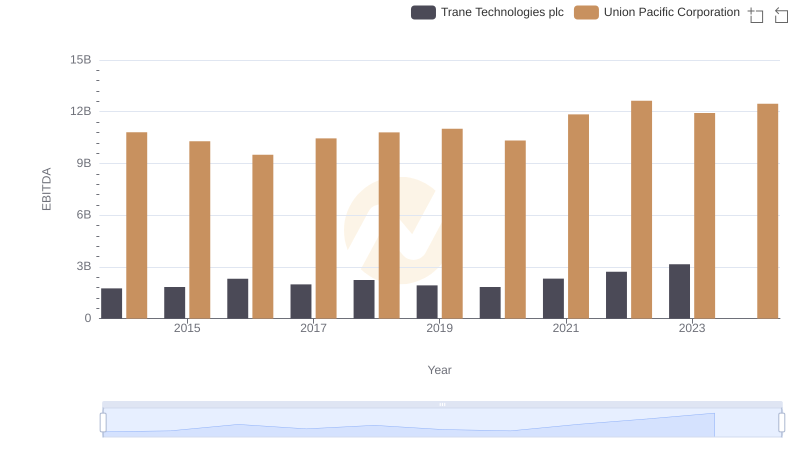
In the ever-evolving landscape of American industry, Union Pacific Corporation and Honeywell International Inc. stand as titans in their respective fields. Over the past decade, from 2014 to 2023, these companies have demonstrated resilience and growth, as reflected in their EBITDA metrics. Union Pacific, a leader in the transportation sector, consistently outperformed Honeywell, an industrial conglomerate, with an average EBITDA approximately 37% higher. Notably, Union Pacific's EBITDA peaked in 2022, showcasing a robust 33% increase from its 2016 low. Meanwhile, Honeywell's EBITDA displayed a more modest growth trajectory, with a notable dip in 2020, likely due to global economic disruptions. Despite this, Honeywell rebounded by 2023, achieving a 29% increase from its 2014 figures. This analysis underscores the dynamic nature of these industries and the strategic maneuvers that drive their financial success.
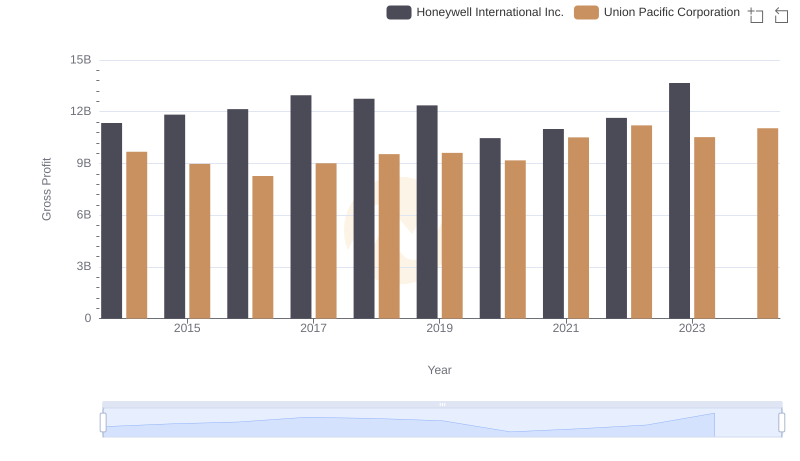
Gross Profit Comparison: Union Pacific Corporation and Honeywell International Inc. Trends
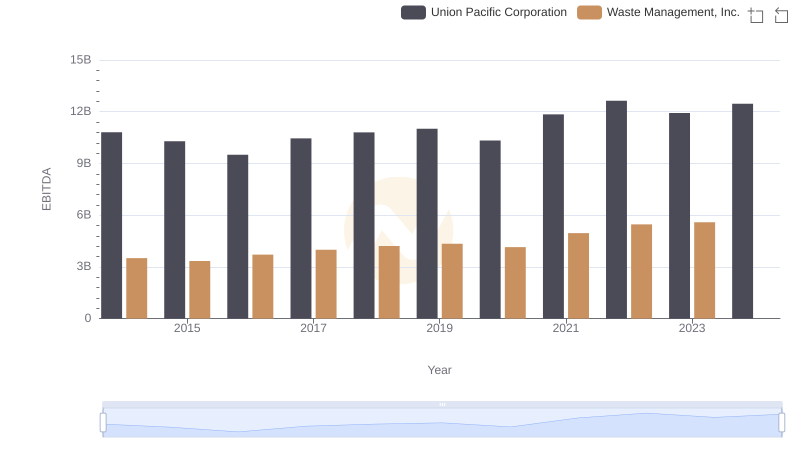
EBITDA Metrics Evaluated: Union Pacific Corporation vs Waste Management, Inc.
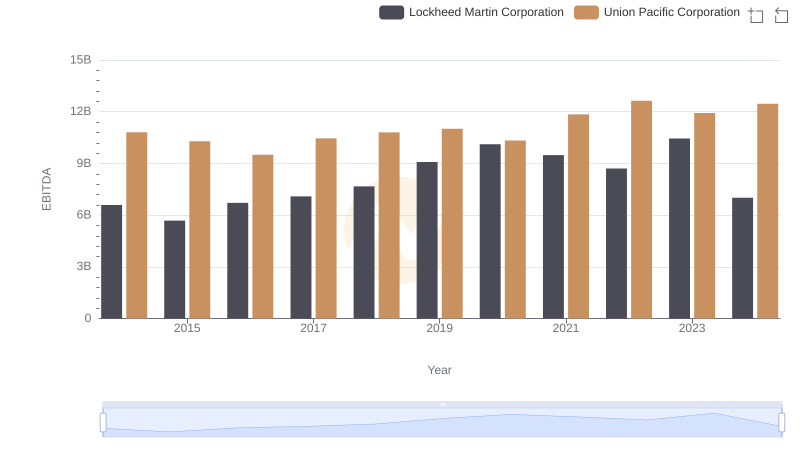
Comparative EBITDA Analysis: Union Pacific Corporation vs Lockheed Martin Corporation

EBITDA Performance Review: Union Pacific Corporation vs Deere & Company
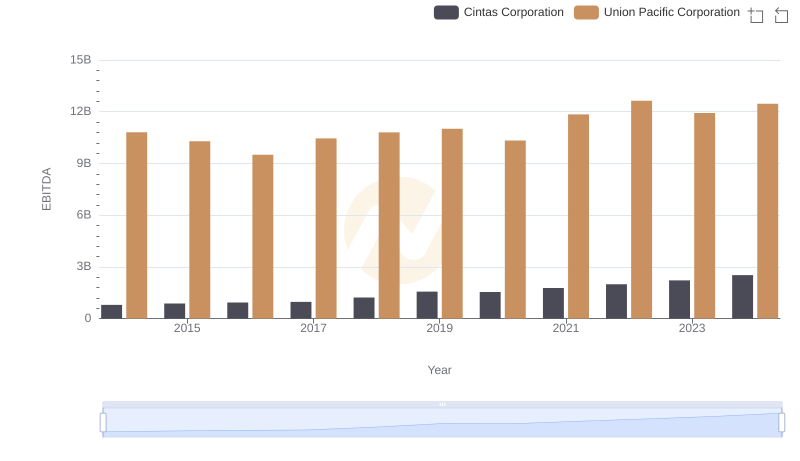
A Side-by-Side Analysis of EBITDA: Union Pacific Corporation and Cintas Corporation
Comparative EBITDA Analysis: Union Pacific Corporation vs Trane Technologies plc