| __timestamp | Eaton Corporation plc | ITT Inc. |
|---|---|---|
| Wednesday, January 1, 2014 | 3810000000 | 519500000 |
| Thursday, January 1, 2015 | 3596000000 | 441500000 |
| Friday, January 1, 2016 | 3505000000 | 444100000 |
| Sunday, January 1, 2017 | 3565000000 | 433700000 |
| Monday, January 1, 2018 | 3548000000 | 427300000 |
| Tuesday, January 1, 2019 | 3583000000 | 420000000 |
| Wednesday, January 1, 2020 | 3075000000 | 347200000 |
| Friday, January 1, 2021 | 3256000000 | 365100000 |
| Saturday, January 1, 2022 | 3227000000 | 368500000 |
| Sunday, January 1, 2023 | 3795000000 | 476600000 |
| Monday, January 1, 2024 | 4077000000 | 502300000 |
Cracking the code
In the ever-evolving landscape of corporate finance, understanding the spending patterns of industry giants can offer valuable insights. Eaton Corporation plc and ITT Inc., two stalwarts in their respective fields, have demonstrated distinct trends in their Selling, General, and Administrative (SG&A) expenses over the past decade.
From 2014 to 2023, Eaton's SG&A expenses have shown a slight decline, with a notable dip in 2020, likely due to global economic disruptions. However, by 2023, Eaton's expenses rebounded to nearly 3.8 billion, reflecting a strategic realignment. In contrast, ITT Inc. maintained a more stable SG&A expenditure, averaging around 420 million annually, with a peak in 2014 and a gradual decrease thereafter.
These patterns highlight the strategic financial maneuvers of both companies, offering a window into their operational priorities and market adaptations.
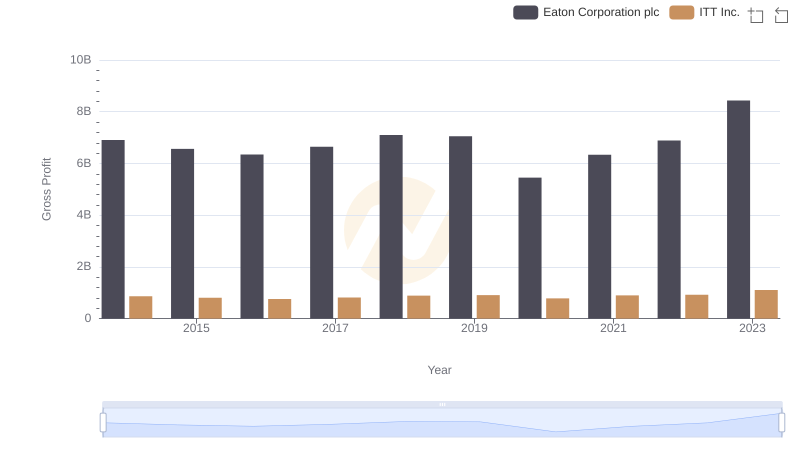
Gross Profit Analysis: Comparing Eaton Corporation plc and ITT Inc.
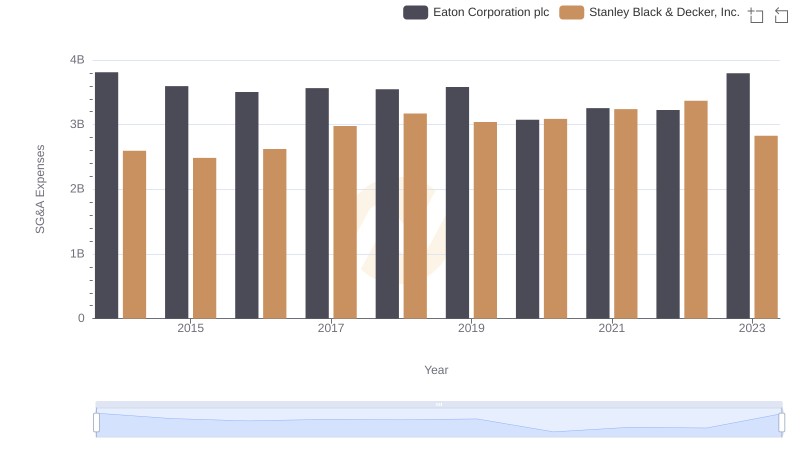
Selling, General, and Administrative Costs: Eaton Corporation plc vs Stanley Black & Decker, Inc.
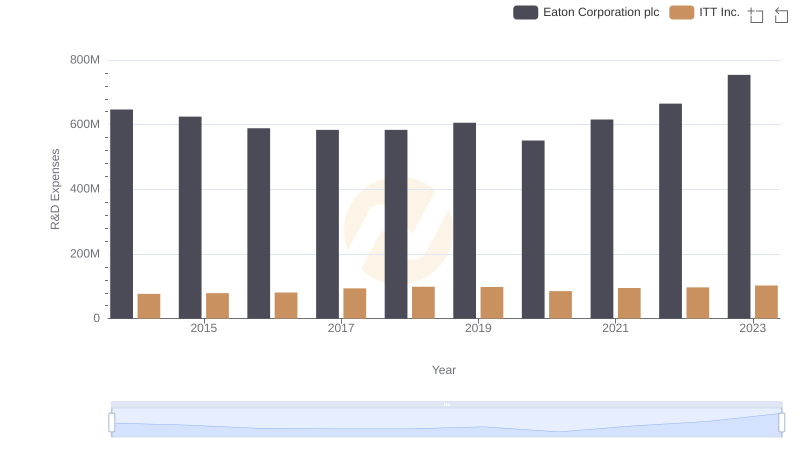
Comparing Innovation Spending: Eaton Corporation plc and ITT Inc.

Comparing SG&A Expenses: Eaton Corporation plc vs Rentokil Initial plc Trends and Insights
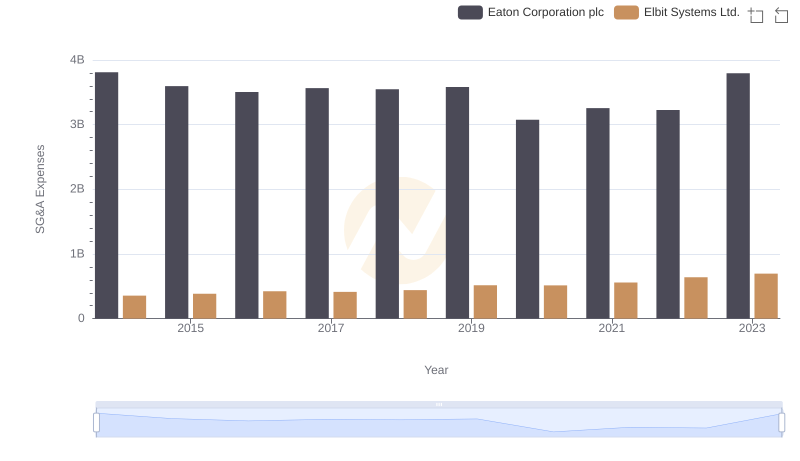
Comparing SG&A Expenses: Eaton Corporation plc vs Elbit Systems Ltd. Trends and Insights
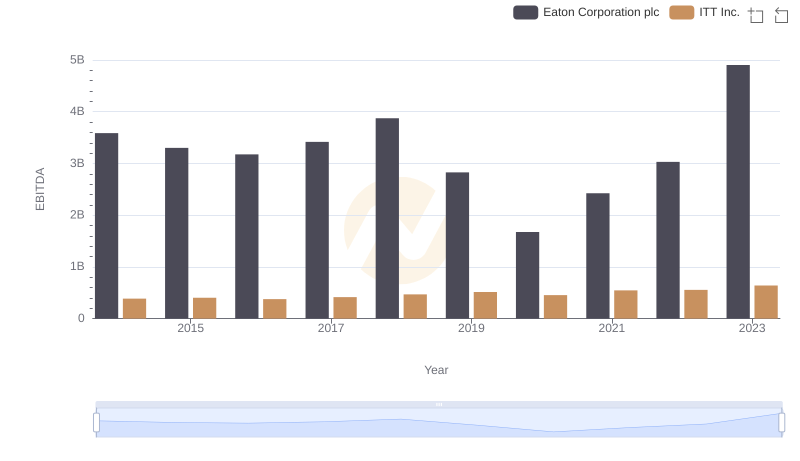
EBITDA Analysis: Evaluating Eaton Corporation plc Against ITT Inc.