| __timestamp | Eaton Corporation plc | ITT Inc. |
|---|---|---|
| Wednesday, January 1, 2014 | 6906000000 | 866400000 |
| Thursday, January 1, 2015 | 6563000000 | 809100000 |
| Friday, January 1, 2016 | 6347000000 | 758200000 |
| Sunday, January 1, 2017 | 6648000000 | 817200000 |
| Monday, January 1, 2018 | 7098000000 | 887200000 |
| Tuesday, January 1, 2019 | 7052000000 | 910100000 |
| Wednesday, January 1, 2020 | 5450000000 | 782200000 |
| Friday, January 1, 2021 | 6335000000 | 899500000 |
| Saturday, January 1, 2022 | 6887000000 | 922300000 |
| Sunday, January 1, 2023 | 8433000000 | 1107300000 |
| Monday, January 1, 2024 | 9503000000 | 1247300000 |
In pursuit of knowledge
In the ever-evolving landscape of industrial manufacturing, understanding financial performance is crucial. This analysis delves into the gross profit trends of Eaton Corporation plc and ITT Inc. from 2014 to 2023. Over this decade, Eaton Corporation plc consistently outperformed ITT Inc., with an average gross profit nearly eight times higher. Notably, Eaton's gross profit peaked in 2023, marking a 22% increase from its 2014 figures, despite a dip in 2020. Meanwhile, ITT Inc. demonstrated steady growth, achieving a 28% rise in gross profit over the same period. This data highlights Eaton's resilience and ITT's steady ascent in the industrial sector. Such insights are invaluable for investors and industry analysts seeking to understand market dynamics and company performance.
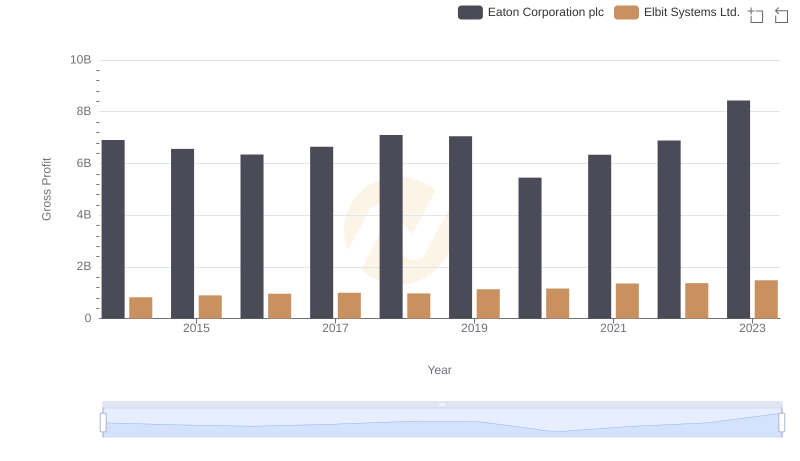
Key Insights on Gross Profit: Eaton Corporation plc vs Elbit Systems Ltd.

Eaton Corporation plc and TFI International Inc.: A Detailed Gross Profit Analysis
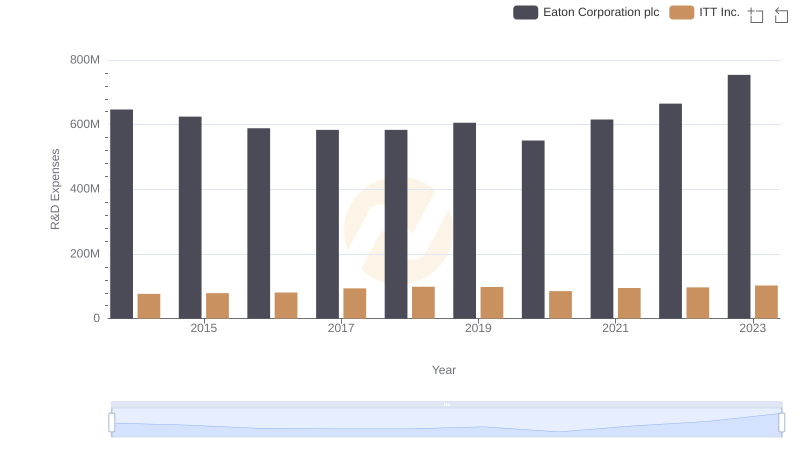
Comparing Innovation Spending: Eaton Corporation plc and ITT Inc.

Eaton Corporation plc and ITT Inc.: SG&A Spending Patterns Compared
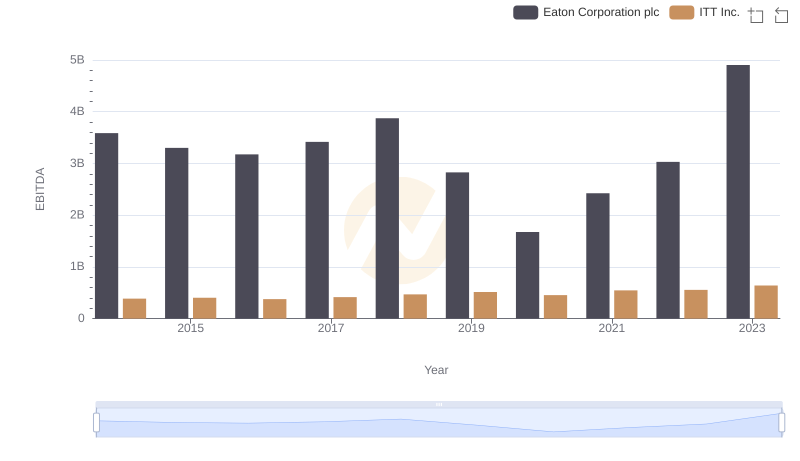
EBITDA Analysis: Evaluating Eaton Corporation plc Against ITT Inc.