| __timestamp | Eaton Corporation plc | Pool Corporation |
|---|---|---|
| Wednesday, January 1, 2014 | 22552000000 | 2246562000 |
| Thursday, January 1, 2015 | 20855000000 | 2363139000 |
| Friday, January 1, 2016 | 19747000000 | 2570803000 |
| Sunday, January 1, 2017 | 20404000000 | 2788188000 |
| Monday, January 1, 2018 | 21609000000 | 2998097000 |
| Tuesday, January 1, 2019 | 21390000000 | 3199517000 |
| Wednesday, January 1, 2020 | 17858000000 | 3936623000 |
| Friday, January 1, 2021 | 19628000000 | 5295584000 |
| Saturday, January 1, 2022 | 20752000000 | 6179727000 |
| Sunday, January 1, 2023 | 23196000000 | 5541595000 |
| Monday, January 1, 2024 | 24878000000 |
Cracking the code
In the ever-evolving landscape of industrial and consumer markets, Eaton Corporation plc and Pool Corporation stand as titans, each carving out their niche. Over the past decade, Eaton, a leader in power management, has seen its revenue fluctuate, with a notable dip in 2020, likely due to global disruptions. However, by 2023, Eaton's revenue rebounded impressively, growing by approximately 30% from its 2020 low.
Meanwhile, Pool Corporation, a major player in the pool and outdoor living industry, has experienced a remarkable growth trajectory. From 2014 to 2022, Pool's revenue surged by nearly 175%, reflecting the increasing demand for home leisure products. Despite a slight dip in 2023, Pool's overall growth remains robust.
This comparison highlights the resilience and adaptability of these corporations in navigating economic challenges and capitalizing on market opportunities.

Comparing Revenue Performance: Eaton Corporation plc or CNH Industrial N.V.?

Eaton Corporation plc vs AECOM: Examining Key Revenue Metrics
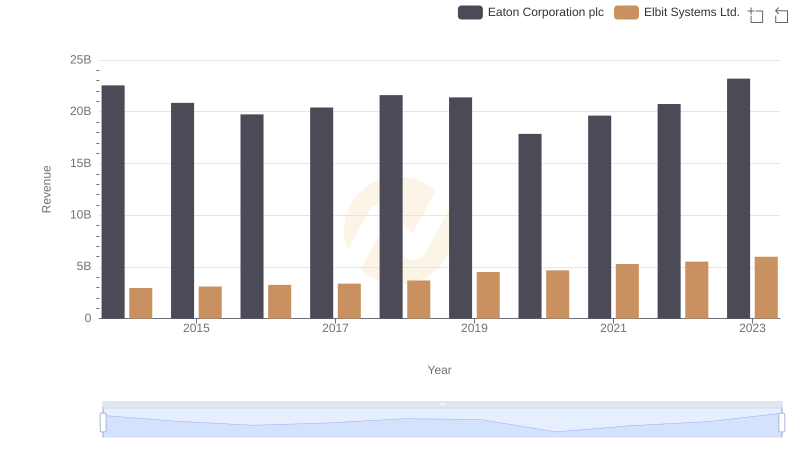
Eaton Corporation plc vs Elbit Systems Ltd.: Examining Key Revenue Metrics
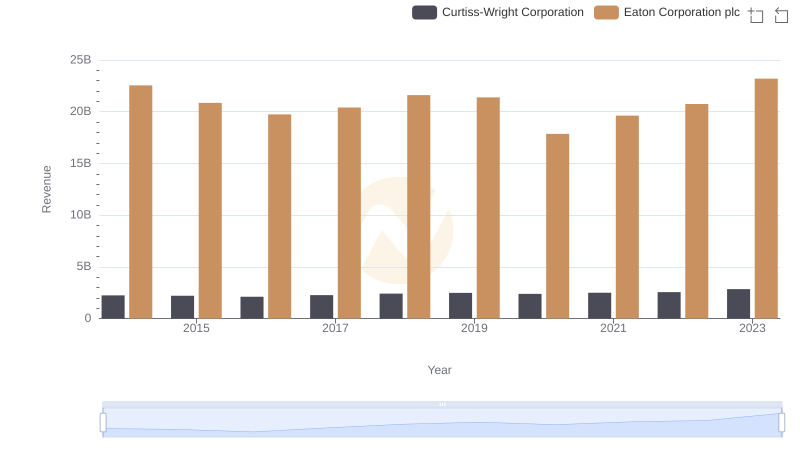
Eaton Corporation plc and Curtiss-Wright Corporation: A Comprehensive Revenue Analysis
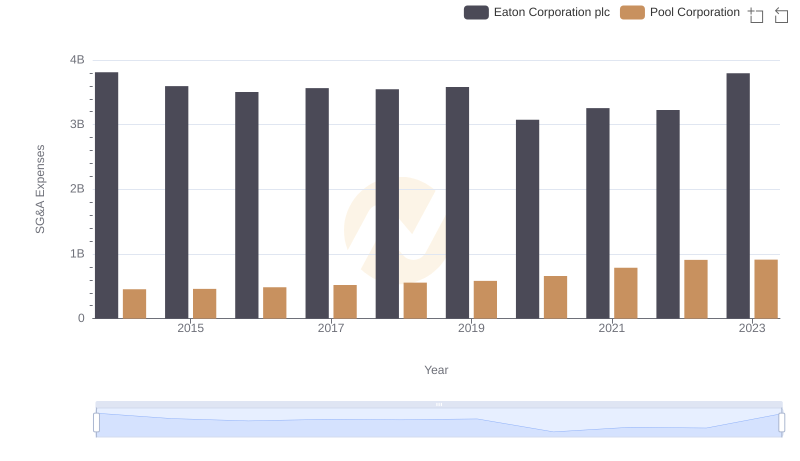
Eaton Corporation plc and Pool Corporation: SG&A Spending Patterns Compared