| __timestamp | AECOM | Eaton Corporation plc |
|---|---|---|
| Wednesday, January 1, 2014 | 4855627000 | 22552000000 |
| Thursday, January 1, 2015 | 17989880000 | 20855000000 |
| Friday, January 1, 2016 | 17410825000 | 19747000000 |
| Sunday, January 1, 2017 | 18203402000 | 20404000000 |
| Monday, January 1, 2018 | 20155512000 | 21609000000 |
| Tuesday, January 1, 2019 | 20173329000 | 21390000000 |
| Wednesday, January 1, 2020 | 13239976000 | 17858000000 |
| Friday, January 1, 2021 | 13340852000 | 19628000000 |
| Saturday, January 1, 2022 | 13148182000 | 20752000000 |
| Sunday, January 1, 2023 | 14378461000 | 23196000000 |
| Monday, January 1, 2024 | 16105498000 | 24878000000 |
Data in motion
In the ever-evolving landscape of industrial and infrastructure sectors, Eaton Corporation plc and AECOM stand as titans. Over the past decade, these companies have showcased remarkable revenue trajectories, reflecting their strategic prowess and market adaptability. From 2014 to 2023, Eaton consistently outperformed AECOM, with revenues peaking at approximately 23% higher in 2023. Notably, Eaton's revenue surged by 30% from 2020 to 2023, highlighting its robust growth strategy. Meanwhile, AECOM experienced a revenue dip in 2020, but rebounded with a 22% increase by 2024, demonstrating resilience amidst market challenges. This comparative analysis underscores the dynamic nature of these industry leaders, offering insights into their financial health and strategic direction. As we look to the future, the missing data for Eaton in 2024 leaves room for speculation on its continued dominance.

Comparing Revenue Performance: Eaton Corporation plc or CNH Industrial N.V.?
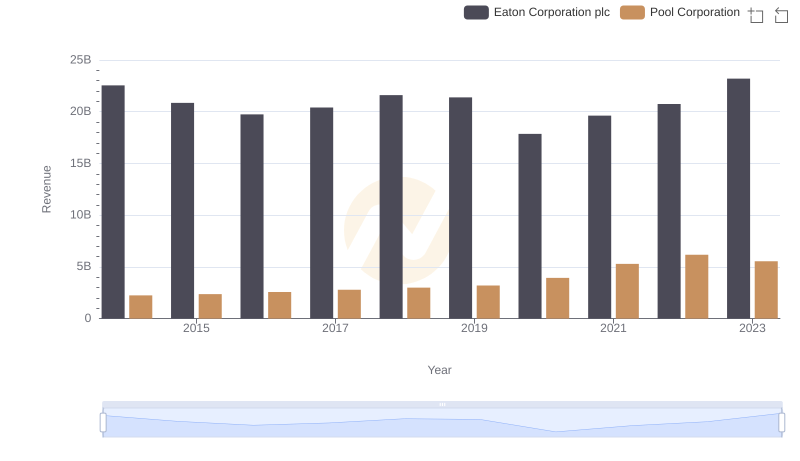
Eaton Corporation plc vs Pool Corporation: Annual Revenue Growth Compared
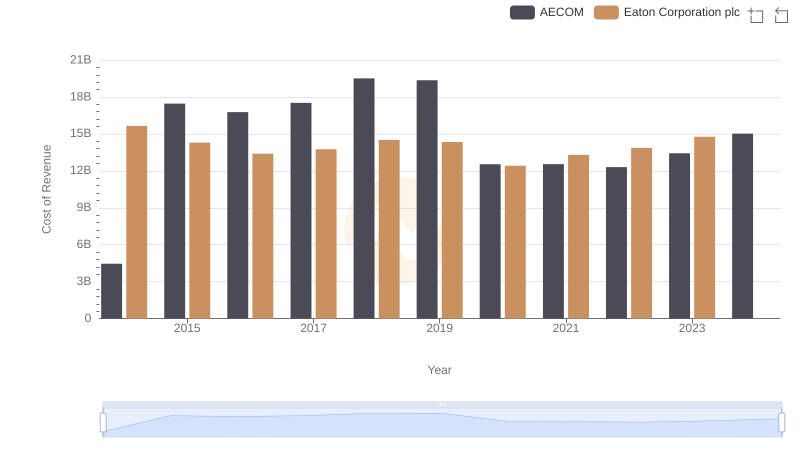
Cost of Revenue Trends: Eaton Corporation plc vs AECOM

Eaton Corporation plc vs Elbit Systems Ltd.: Examining Key Revenue Metrics
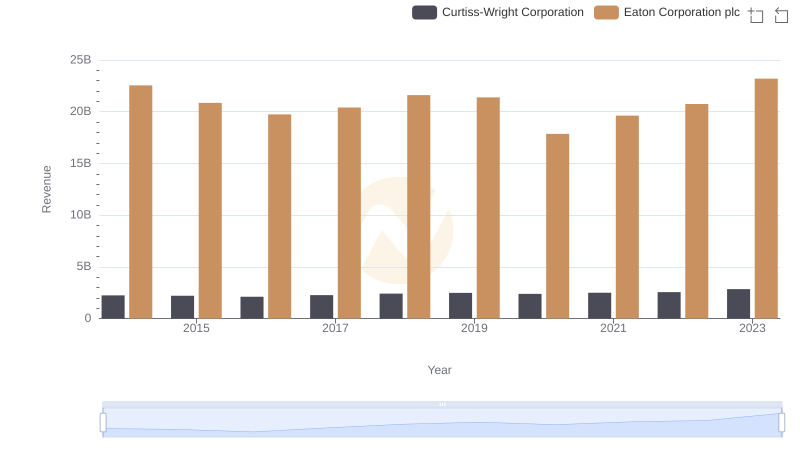
Eaton Corporation plc and Curtiss-Wright Corporation: A Comprehensive Revenue Analysis
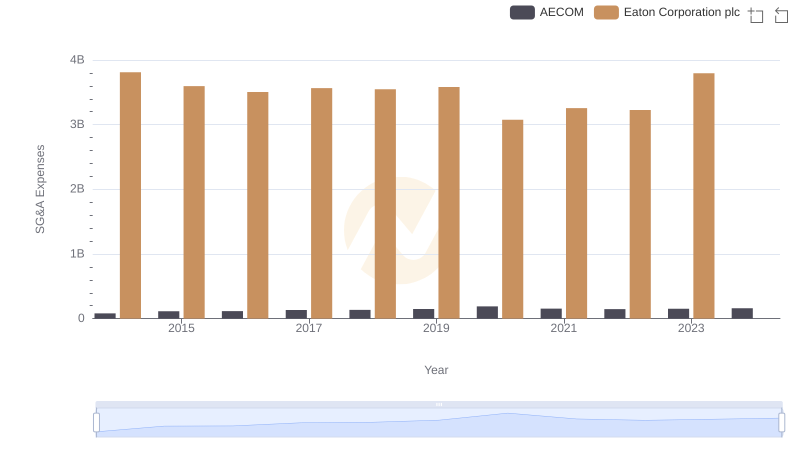
Breaking Down SG&A Expenses: Eaton Corporation plc vs AECOM