| __timestamp | CNH Industrial N.V. | Eaton Corporation plc |
|---|---|---|
| Wednesday, January 1, 2014 | 32555000000 | 22552000000 |
| Thursday, January 1, 2015 | 25912000000 | 20855000000 |
| Friday, January 1, 2016 | 24872000000 | 19747000000 |
| Sunday, January 1, 2017 | 27361000000 | 20404000000 |
| Monday, January 1, 2018 | 29706000000 | 21609000000 |
| Tuesday, January 1, 2019 | 28079000000 | 21390000000 |
| Wednesday, January 1, 2020 | 26032000000 | 17858000000 |
| Friday, January 1, 2021 | 33428000000 | 19628000000 |
| Saturday, January 1, 2022 | 23551000000 | 20752000000 |
| Sunday, January 1, 2023 | 24694000000 | 23196000000 |
| Monday, January 1, 2024 | 24878000000 |
Cracking the code
In the competitive landscape of industrial giants, Eaton Corporation plc and CNH Industrial N.V. have been vying for revenue supremacy over the past decade. From 2014 to 2023, CNH Industrial consistently outperformed Eaton in terms of revenue, peaking in 2021 with a 34% increase from its 2020 figures. However, Eaton has shown resilience, closing the gap significantly by 2023, with a 30% rise in revenue since 2020.
The data reveals a fascinating trend: while CNH Industrial's revenue fluctuated, Eaton's revenue trajectory was more stable, with a notable surge in 2023. This suggests Eaton's strategic initiatives are paying off, potentially positioning it as a formidable contender in the coming years. As the industrial sector evolves, these two powerhouses continue to adapt, innovate, and compete for market leadership.
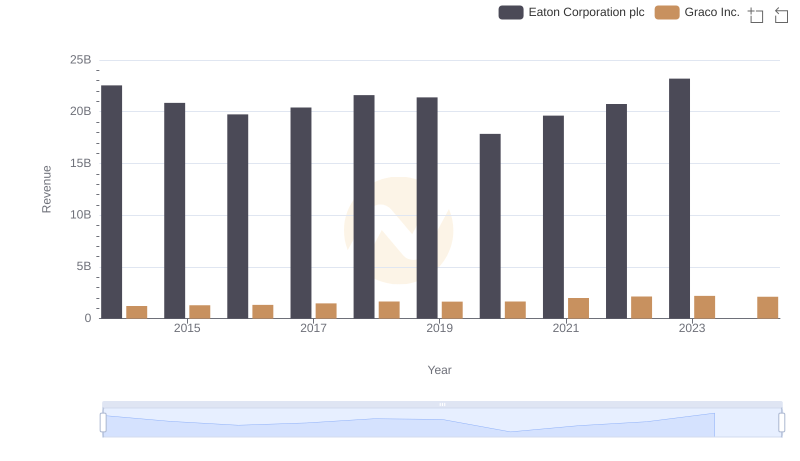
Breaking Down Revenue Trends: Eaton Corporation plc vs Graco Inc.

Eaton Corporation plc vs AECOM: Examining Key Revenue Metrics
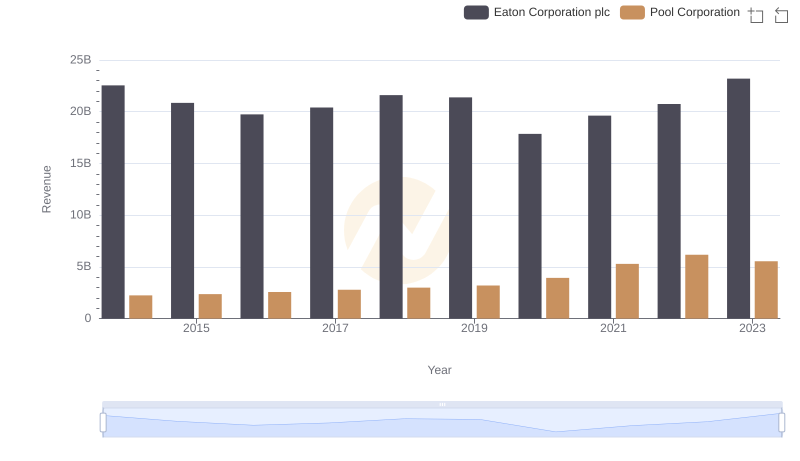
Eaton Corporation plc vs Pool Corporation: Annual Revenue Growth Compared
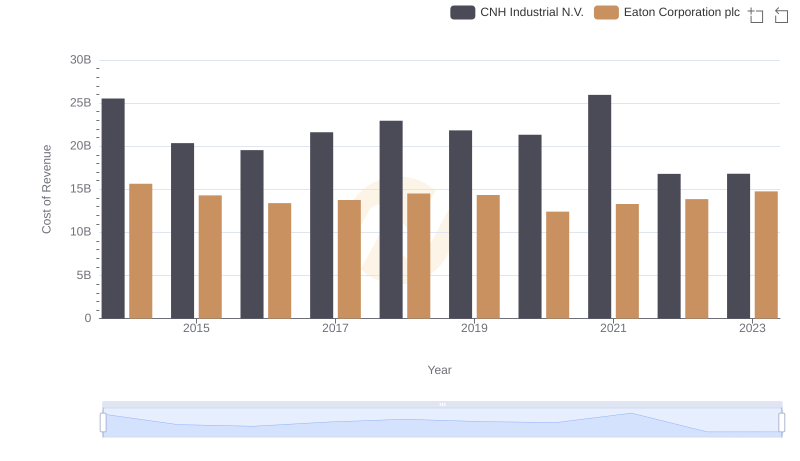
Eaton Corporation plc vs CNH Industrial N.V.: Efficiency in Cost of Revenue Explored

Eaton Corporation plc or CNH Industrial N.V.: Who Invests More in Innovation?
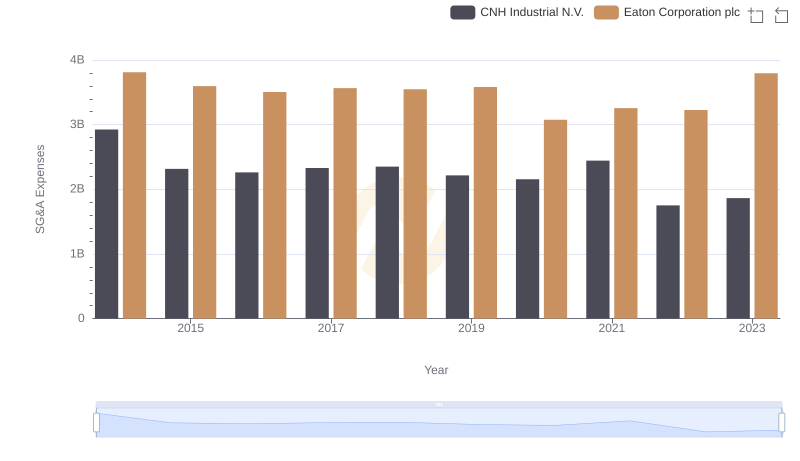
Eaton Corporation plc and CNH Industrial N.V.: SG&A Spending Patterns Compared