| __timestamp | Eaton Corporation plc | Pool Corporation |
|---|---|---|
| Wednesday, January 1, 2014 | 3810000000 | 454470000 |
| Thursday, January 1, 2015 | 3596000000 | 459422000 |
| Friday, January 1, 2016 | 3505000000 | 485228000 |
| Sunday, January 1, 2017 | 3565000000 | 520918000 |
| Monday, January 1, 2018 | 3548000000 | 556284000 |
| Tuesday, January 1, 2019 | 3583000000 | 583679000 |
| Wednesday, January 1, 2020 | 3075000000 | 659931000 |
| Friday, January 1, 2021 | 3256000000 | 786808000 |
| Saturday, January 1, 2022 | 3227000000 | 907629000 |
| Sunday, January 1, 2023 | 3795000000 | 912927000 |
| Monday, January 1, 2024 | 4077000000 |
Infusing magic into the data realm
In the world of corporate finance, understanding spending patterns is crucial for strategic planning. Over the past decade, Eaton Corporation plc and Pool Corporation have showcased distinct trends in their Selling, General, and Administrative (SG&A) expenses. From 2014 to 2023, Eaton's SG&A expenses fluctuated, peaking in 2014 and 2023, with a notable dip in 2020. This reflects a strategic tightening during challenging economic times. In contrast, Pool Corporation exhibited a steady upward trajectory, with expenses more than doubling from 2014 to 2023. This growth mirrors Pool's aggressive expansion and market penetration strategies. By 2023, Pool's SG&A expenses reached nearly 24% of Eaton's, highlighting its rapid growth. These patterns offer a window into each company's operational focus and market strategy, providing valuable insights for investors and analysts alike.
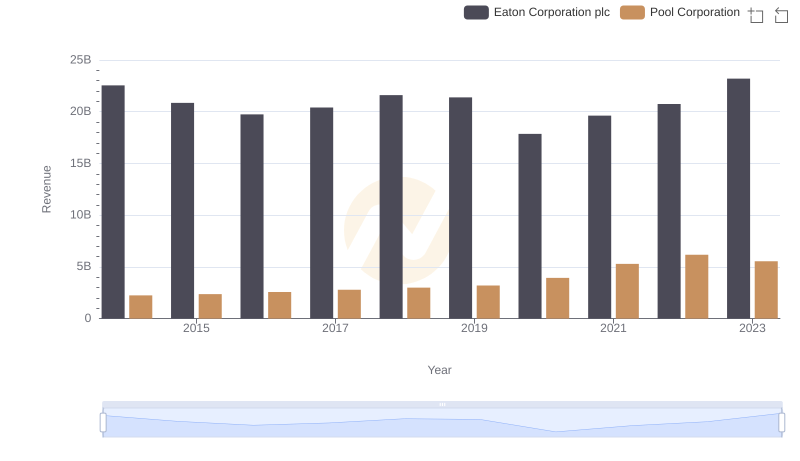
Eaton Corporation plc vs Pool Corporation: Annual Revenue Growth Compared
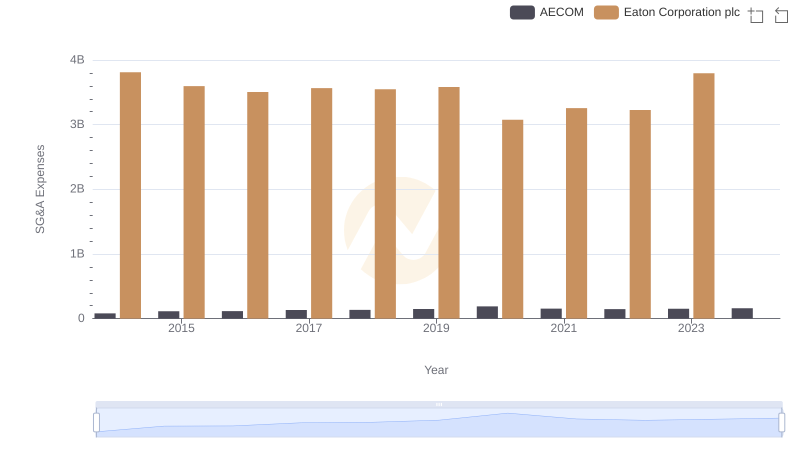
Breaking Down SG&A Expenses: Eaton Corporation plc vs AECOM
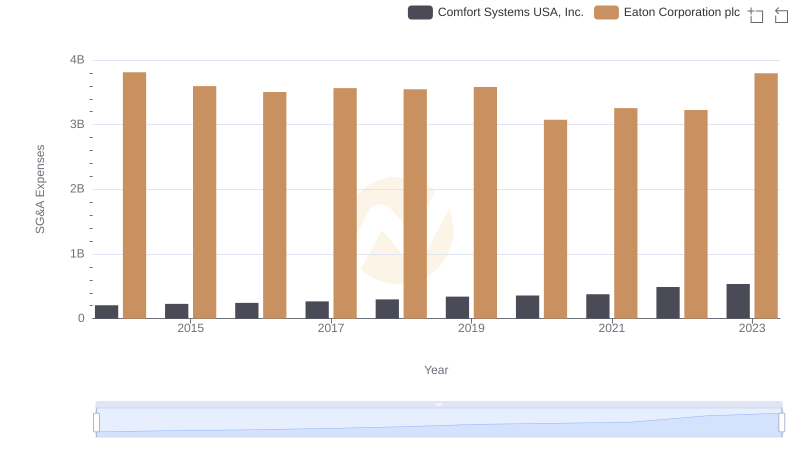
Eaton Corporation plc and Comfort Systems USA, Inc.: SG&A Spending Patterns Compared
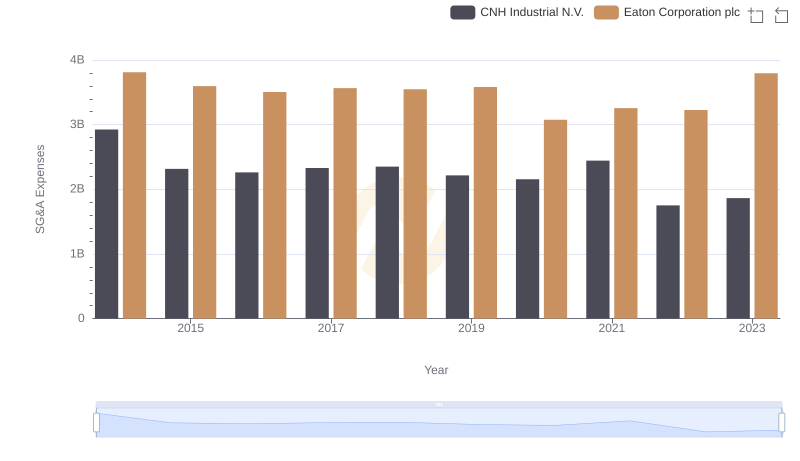
Eaton Corporation plc and CNH Industrial N.V.: SG&A Spending Patterns Compared
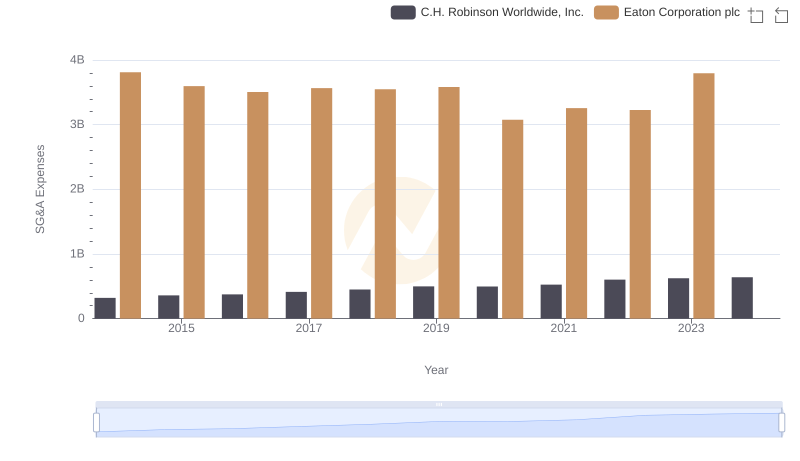
Cost Management Insights: SG&A Expenses for Eaton Corporation plc and C.H. Robinson Worldwide, Inc.
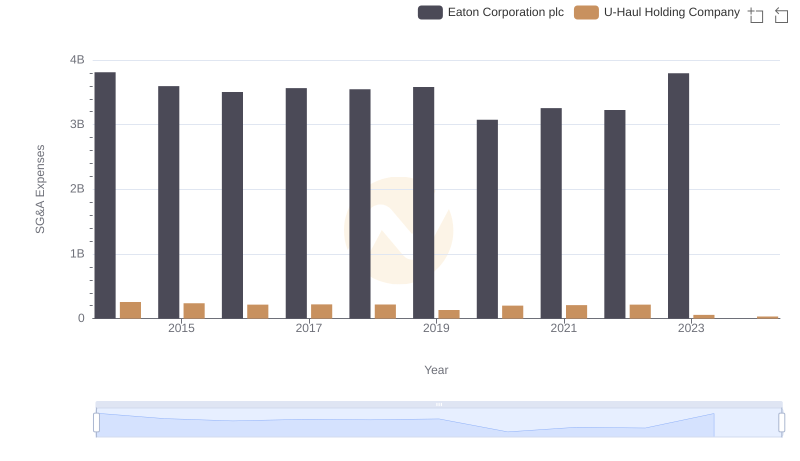
Eaton Corporation plc vs U-Haul Holding Company: SG&A Expense Trends