| __timestamp | AECOM | Eaton Corporation plc |
|---|---|---|
| Wednesday, January 1, 2014 | 4452451000 | 15646000000 |
| Thursday, January 1, 2015 | 17454692000 | 14292000000 |
| Friday, January 1, 2016 | 16768001000 | 13400000000 |
| Sunday, January 1, 2017 | 17519682000 | 13756000000 |
| Monday, January 1, 2018 | 19504863000 | 14511000000 |
| Tuesday, January 1, 2019 | 19359884000 | 14338000000 |
| Wednesday, January 1, 2020 | 12530416000 | 12408000000 |
| Friday, January 1, 2021 | 12542431000 | 13293000000 |
| Saturday, January 1, 2022 | 12300208000 | 13865000000 |
| Sunday, January 1, 2023 | 13432996000 | 14763000000 |
| Monday, January 1, 2024 | 15021157000 | 15375000000 |
Igniting the spark of knowledge
In the ever-evolving landscape of industrial and infrastructure services, Eaton Corporation plc and AECOM have emerged as pivotal players. Over the past decade, these companies have showcased distinct trends in their cost of revenue, reflecting their strategic priorities and market dynamics.
From 2014 to 2023, AECOM's cost of revenue exhibited a remarkable 200% increase, peaking in 2018. This surge underscores AECOM's aggressive expansion and project execution capabilities. However, a notable dip in 2020, likely due to global disruptions, was followed by a steady recovery, reaching approximately 13.4 billion in 2023.
Eaton Corporation plc, on the other hand, maintained a more consistent trajectory. Despite a slight decline in 2020, Eaton's cost of revenue rebounded, achieving a 19% increase by 2023. This stability highlights Eaton's resilience and strategic focus on core operations.
As we look to the future, the absence of 2024 data for Eaton suggests potential shifts in strategy or market conditions. Stay tuned for more insights as these industry titans continue to shape the global landscape.

Eaton Corporation plc vs AECOM: Examining Key Revenue Metrics
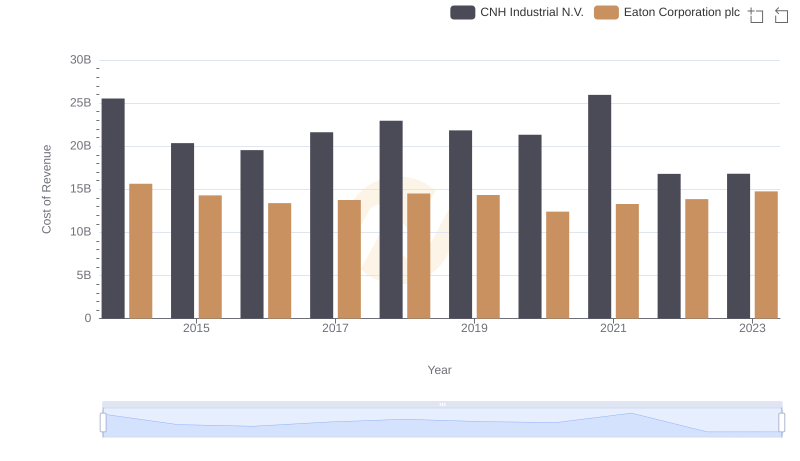
Eaton Corporation plc vs CNH Industrial N.V.: Efficiency in Cost of Revenue Explored

Eaton Corporation plc vs Saia, Inc.: Efficiency in Cost of Revenue Explored
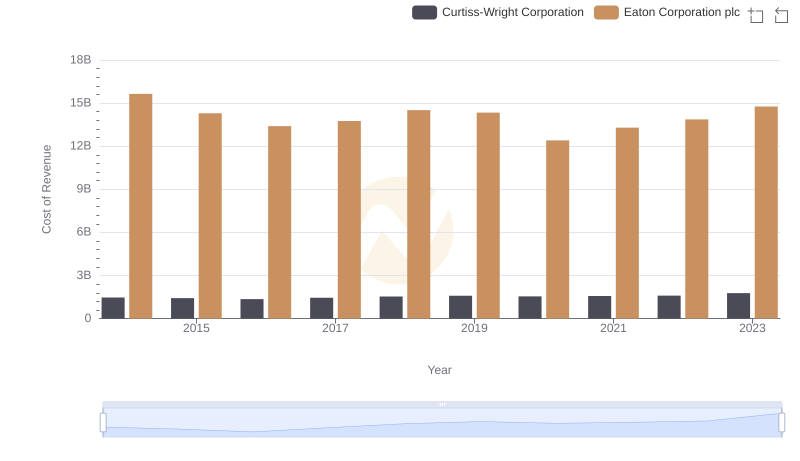
Cost of Revenue: Key Insights for Eaton Corporation plc and Curtiss-Wright Corporation

Cost of Revenue: Key Insights for Eaton Corporation plc and C.H. Robinson Worldwide, Inc.
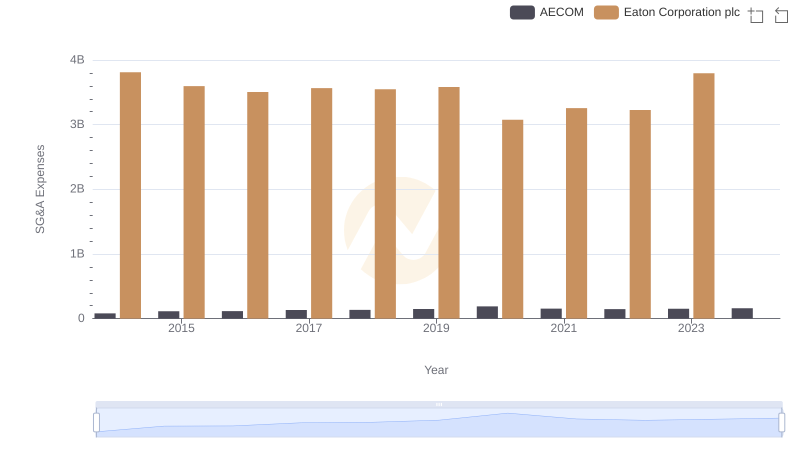
Breaking Down SG&A Expenses: Eaton Corporation plc vs AECOM