| __timestamp | Eaton Corporation plc | Old Dominion Freight Line, Inc. |
|---|---|---|
| Wednesday, January 1, 2014 | 6906000000 | 687488000 |
| Thursday, January 1, 2015 | 6563000000 | 757499000 |
| Friday, January 1, 2016 | 6347000000 | 744627000 |
| Sunday, January 1, 2017 | 6648000000 | 875380000 |
| Monday, January 1, 2018 | 7098000000 | 1144243000 |
| Tuesday, January 1, 2019 | 7052000000 | 1170216000 |
| Wednesday, January 1, 2020 | 5450000000 | 1228598000 |
| Friday, January 1, 2021 | 6335000000 | 1775060000 |
| Saturday, January 1, 2022 | 6887000000 | 2256126000 |
| Sunday, January 1, 2023 | 8433000000 | 2072199000 |
| Monday, January 1, 2024 | 9503000000 |
Unleashing the power of data
In the ever-evolving landscape of industrial and freight sectors, understanding financial performance is crucial. This analysis delves into the gross profit trends of Eaton Corporation plc and Old Dominion Freight Line, Inc. from 2014 to 2023. Eaton, a leader in power management, consistently outperformed Old Dominion, a prominent freight carrier, with an average gross profit nearly five times higher. Notably, Eaton's gross profit surged by approximately 22% from 2022 to 2023, reaching its peak. Meanwhile, Old Dominion experienced a remarkable growth trajectory, with its gross profit more than tripling over the decade, peaking in 2022. The data highlights Eaton's resilience and Old Dominion's impressive growth, reflecting broader industry trends. As we navigate through economic shifts, these insights offer a glimpse into the strategic maneuvers of these industry giants.

Eaton Corporation plc vs Old Dominion Freight Line, Inc.: Annual Revenue Growth Compared
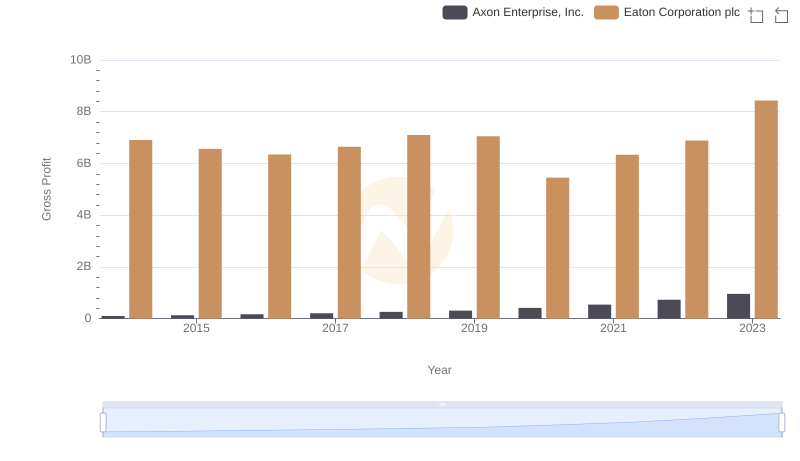
Gross Profit Analysis: Comparing Eaton Corporation plc and Axon Enterprise, Inc.
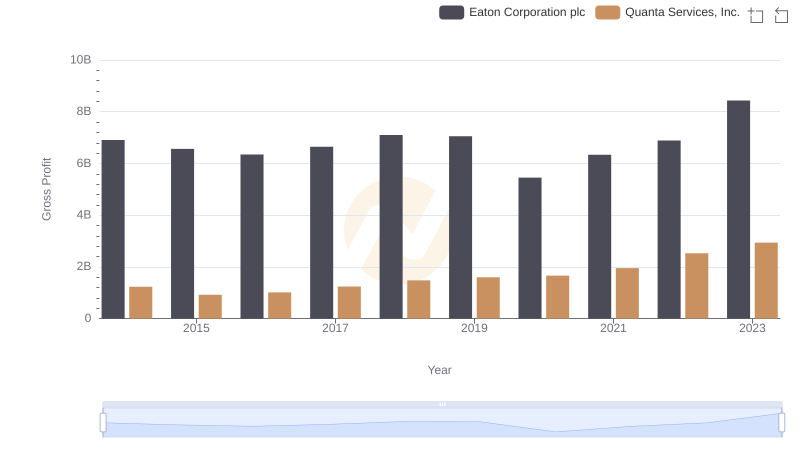
Who Generates Higher Gross Profit? Eaton Corporation plc or Quanta Services, Inc.
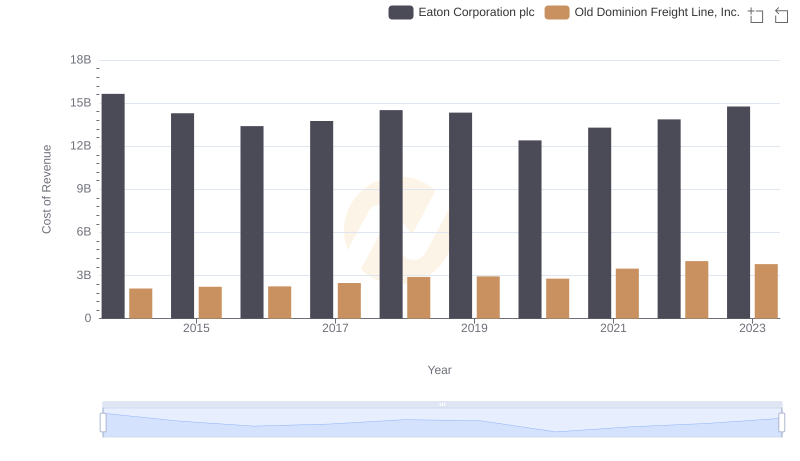
Cost of Revenue Trends: Eaton Corporation plc vs Old Dominion Freight Line, Inc.
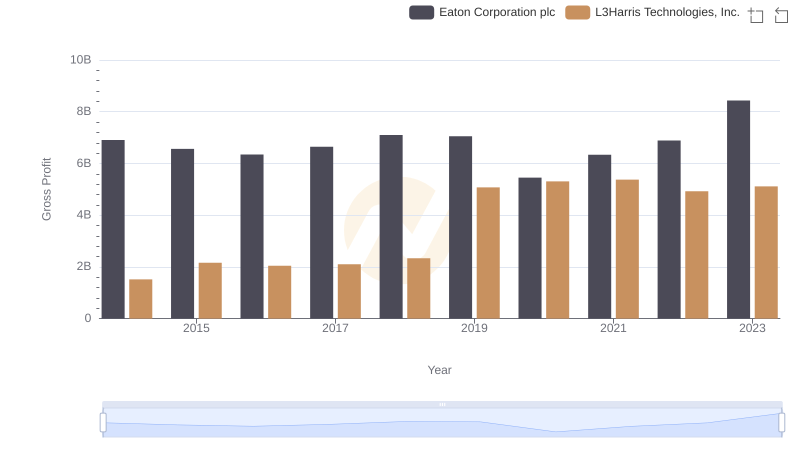
Gross Profit Comparison: Eaton Corporation plc and L3Harris Technologies, Inc. Trends
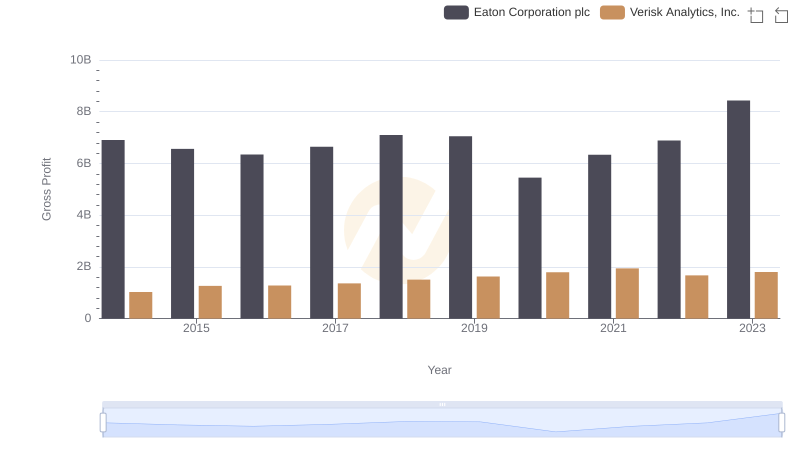
Gross Profit Comparison: Eaton Corporation plc and Verisk Analytics, Inc. Trends
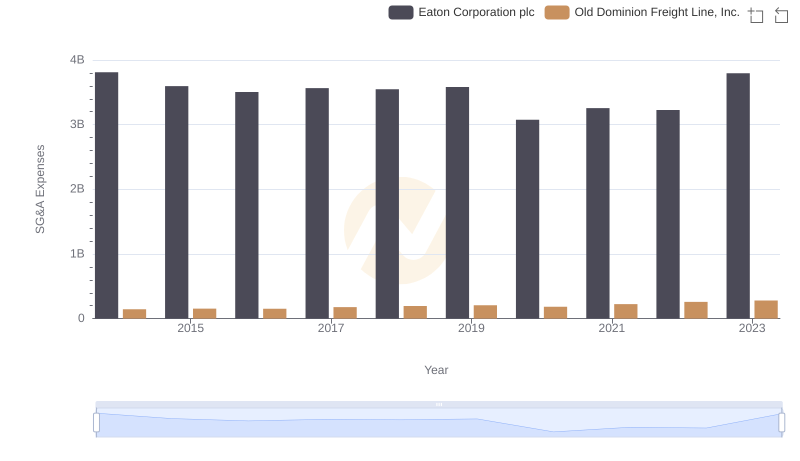
Eaton Corporation plc or Old Dominion Freight Line, Inc.: Who Manages SG&A Costs Better?