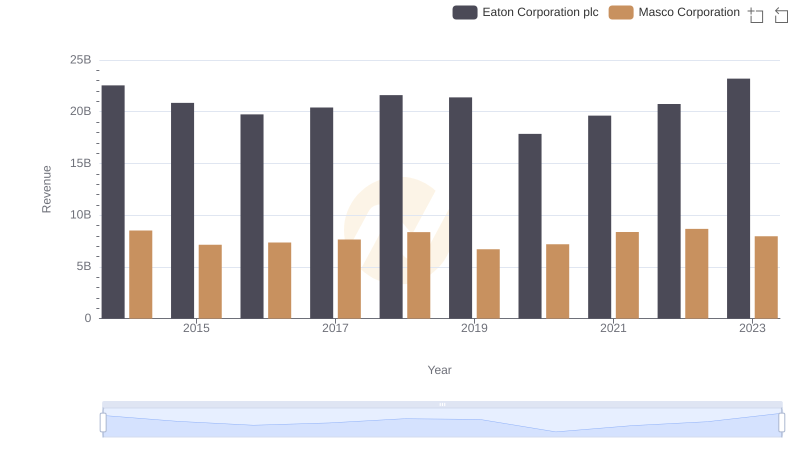
| __timestamp | Eaton Corporation plc | Masco Corporation |
|---|---|---|
| Wednesday, January 1, 2014 | 3810000000 | 1607000000 |
| Thursday, January 1, 2015 | 3596000000 | 1339000000 |
| Friday, January 1, 2016 | 3505000000 | 1403000000 |
| Sunday, January 1, 2017 | 3565000000 | 1442000000 |
| Monday, January 1, 2018 | 3548000000 | 1478000000 |
| Tuesday, January 1, 2019 | 3583000000 | 1274000000 |
| Wednesday, January 1, 2020 | 3075000000 | 1292000000 |
| Friday, January 1, 2021 | 3256000000 | 1413000000 |
| Saturday, January 1, 2022 | 3227000000 | 1390000000 |
| Sunday, January 1, 2023 | 3795000000 | 1481000000 |
| Monday, January 1, 2024 | 4077000000 | 1468000000 |
Unveiling the hidden dimensions of data
In the competitive landscape of industrial manufacturing, understanding the efficiency of Selling, General, and Administrative (SG&A) expenses is crucial. Over the past decade, Eaton Corporation plc and Masco Corporation have demonstrated distinct trends in their SG&A expenditures. From 2014 to 2023, Eaton's SG&A expenses fluctuated, peaking in 2014 and 2023, with a notable dip in 2020. This reflects a strategic shift, possibly due to market conditions or internal restructuring. Meanwhile, Masco Corporation maintained a more stable trajectory, with a slight increase in 2023 compared to 2014. Eaton's expenses were consistently more than double those of Masco, highlighting different operational scales and strategies. This analysis provides valuable insights into how these industry giants manage their operational costs, offering a window into their financial health and strategic priorities.
Eaton Corporation plc vs Masco Corporation: Examining Key Revenue Metrics
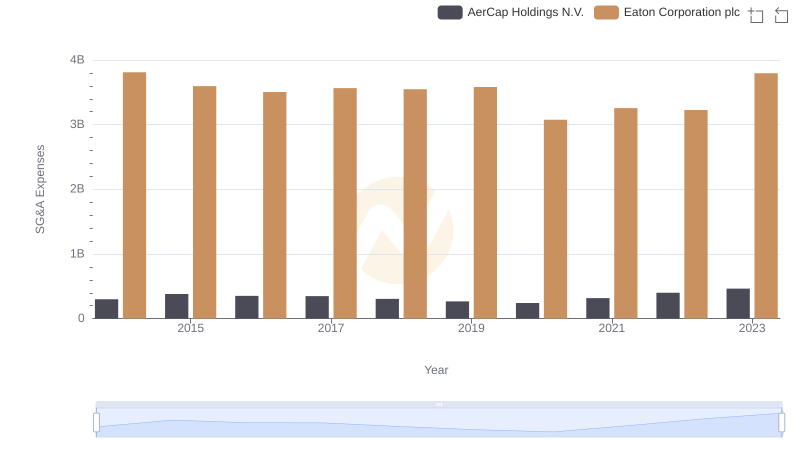
Who Optimizes SG&A Costs Better? Eaton Corporation plc or AerCap Holdings N.V.
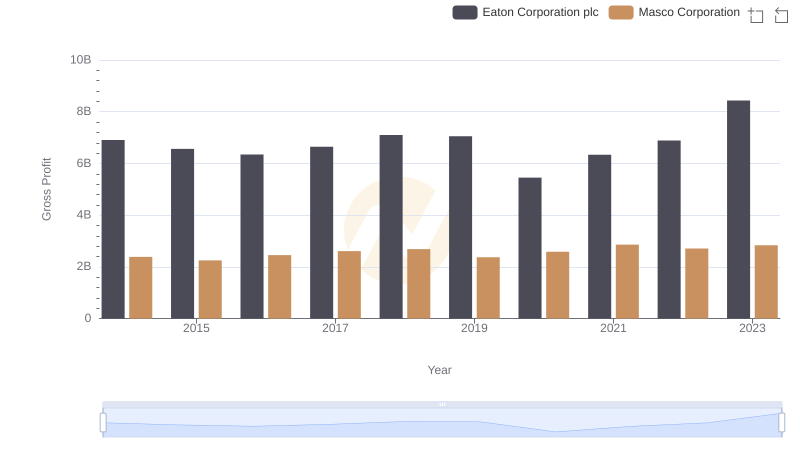
Eaton Corporation plc and Masco Corporation: A Detailed Gross Profit Analysis
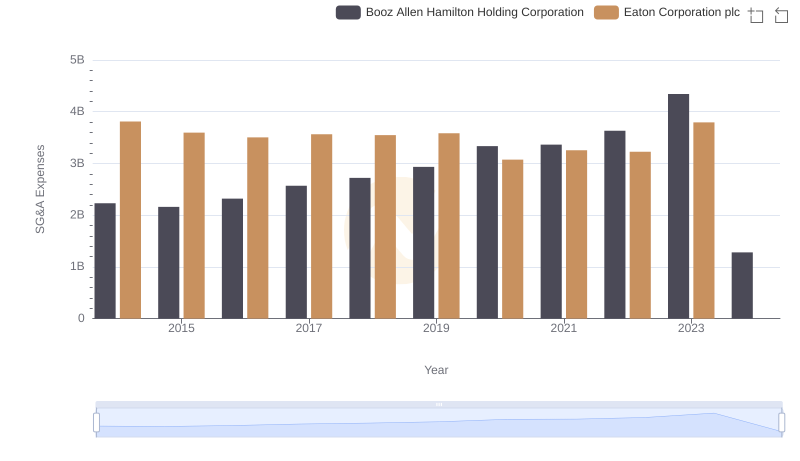
Who Optimizes SG&A Costs Better? Eaton Corporation plc or Booz Allen Hamilton Holding Corporation
Eaton Corporation plc vs Jacobs Engineering Group Inc.: SG&A Expense Trends