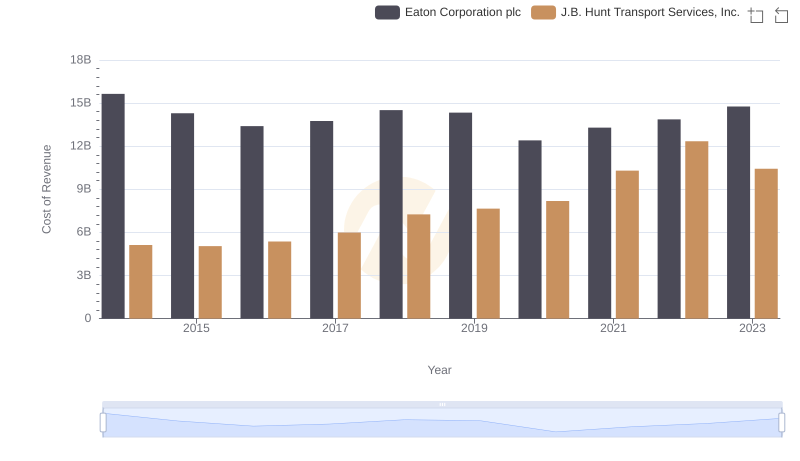
| __timestamp | Eaton Corporation plc | J.B. Hunt Transport Services, Inc. |
|---|---|---|
| Wednesday, January 1, 2014 | 6906000000 | 1041346000 |
| Thursday, January 1, 2015 | 6563000000 | 1146174000 |
| Friday, January 1, 2016 | 6347000000 | 1185633000 |
| Sunday, January 1, 2017 | 6648000000 | 1199293000 |
| Monday, January 1, 2018 | 7098000000 | 1359217000 |
| Tuesday, January 1, 2019 | 7052000000 | 1506255000 |
| Wednesday, January 1, 2020 | 5450000000 | 1449876000 |
| Friday, January 1, 2021 | 6335000000 | 1869819000 |
| Saturday, January 1, 2022 | 6887000000 | 2472527000 |
| Sunday, January 1, 2023 | 8433000000 | 2396388000 |
| Monday, January 1, 2024 | 9503000000 |
Unleashing insights
In the ever-evolving landscape of American industry, Eaton Corporation plc and J.B. Hunt Transport Services, Inc. stand as titans in their respective fields. Over the past decade, Eaton, a leader in power management, has consistently outperformed J.B. Hunt, a major player in transportation logistics, in terms of gross profit. From 2014 to 2023, Eaton's gross profit surged by approximately 22%, peaking in 2023 with a remarkable 8.4 billion. In contrast, J.B. Hunt experienced a robust 130% increase, reaching its zenith in 2022 with 2.5 billion, before slightly declining in 2023. This comparison highlights Eaton's steady growth and J.B. Hunt's dynamic expansion, reflecting broader economic trends and sector-specific challenges. As we delve into these financial narratives, the data underscores the resilience and adaptability of these corporations in a competitive market.