| __timestamp | CNH Industrial N.V. | Eaton Corporation plc |
|---|---|---|
| Wednesday, January 1, 2014 | 2925000000 | 3810000000 |
| Thursday, January 1, 2015 | 2317000000 | 3596000000 |
| Friday, January 1, 2016 | 2262000000 | 3505000000 |
| Sunday, January 1, 2017 | 2330000000 | 3565000000 |
| Monday, January 1, 2018 | 2351000000 | 3548000000 |
| Tuesday, January 1, 2019 | 2216000000 | 3583000000 |
| Wednesday, January 1, 2020 | 2155000000 | 3075000000 |
| Friday, January 1, 2021 | 2443000000 | 3256000000 |
| Saturday, January 1, 2022 | 1752000000 | 3227000000 |
| Sunday, January 1, 2023 | 1863000000 | 3795000000 |
| Monday, January 1, 2024 | 4077000000 |
Unveiling the hidden dimensions of data
In the competitive landscape of industrial giants, Eaton Corporation plc and CNH Industrial N.V. have showcased distinct trends in their Selling, General, and Administrative (SG&A) expenses over the past decade. From 2014 to 2023, Eaton consistently outspent CNH, with an average SG&A expense of approximately 3.5 billion USD, compared to CNH's 2.3 billion USD. Notably, Eaton's SG&A expenses peaked in 2014, reaching nearly 3.8 billion USD, while CNH's highest expenditure was around 2.9 billion USD in the same year.
By 2023, Eaton's SG&A expenses rebounded to 3.8 billion USD, marking a 23% increase from its 2020 low. In contrast, CNH's expenses saw a significant decline, dropping to 1.9 billion USD in 2023, a 36% decrease from its 2014 peak. These trends reflect strategic shifts and market dynamics influencing each company's operational focus.

Comparing Revenue Performance: Eaton Corporation plc or CNH Industrial N.V.?
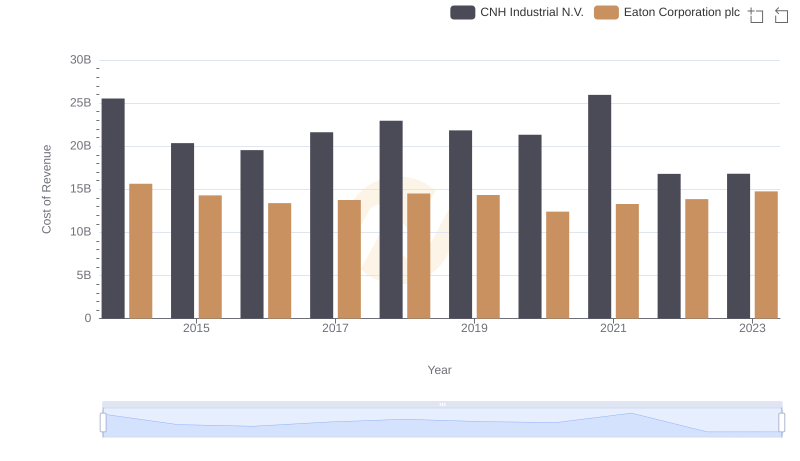
Eaton Corporation plc vs CNH Industrial N.V.: Efficiency in Cost of Revenue Explored

Eaton Corporation plc or CNH Industrial N.V.: Who Invests More in Innovation?
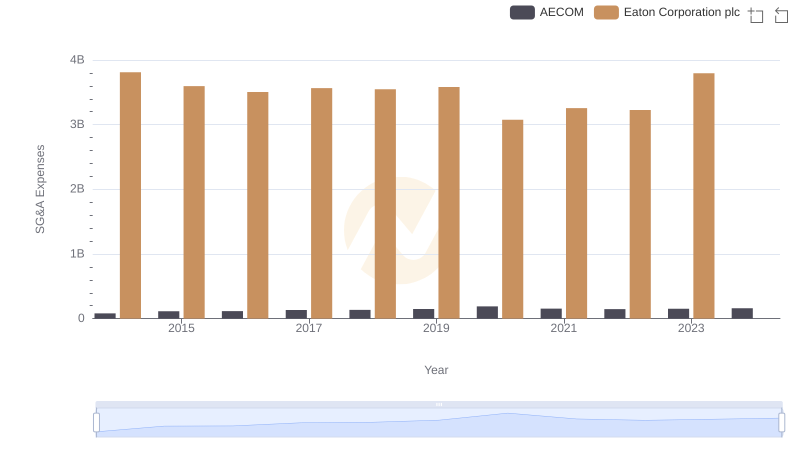
Breaking Down SG&A Expenses: Eaton Corporation plc vs AECOM
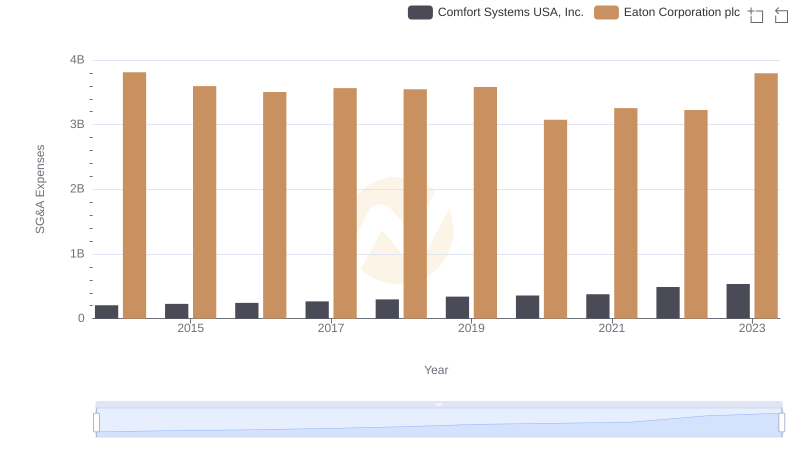
Eaton Corporation plc and Comfort Systems USA, Inc.: SG&A Spending Patterns Compared
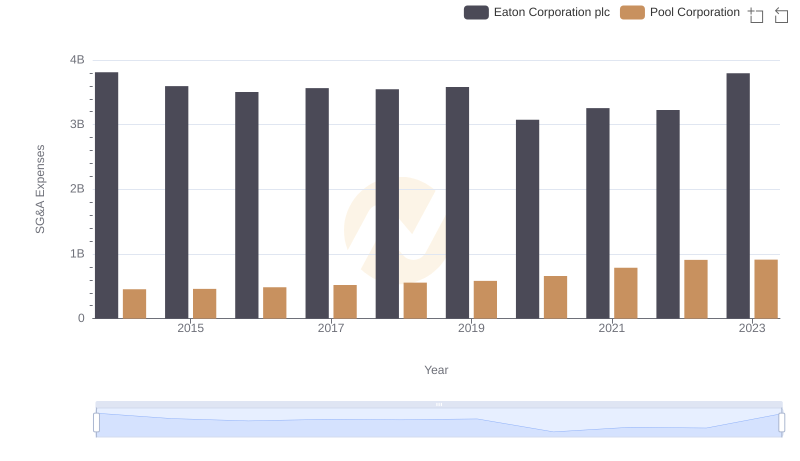
Eaton Corporation plc and Pool Corporation: SG&A Spending Patterns Compared
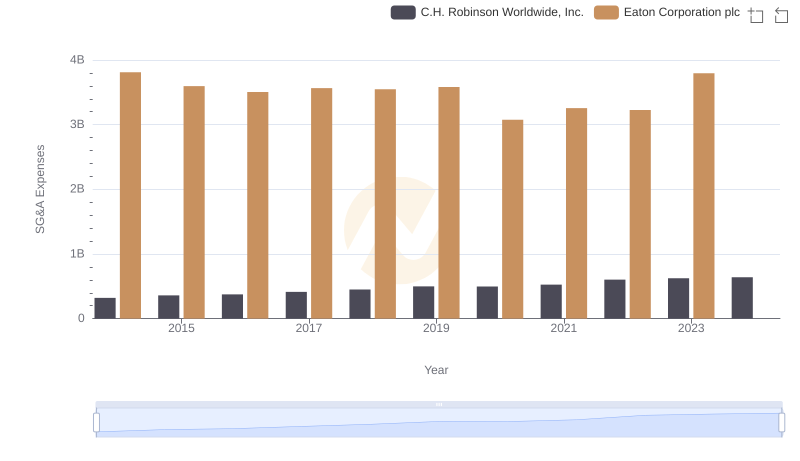
Cost Management Insights: SG&A Expenses for Eaton Corporation plc and C.H. Robinson Worldwide, Inc.
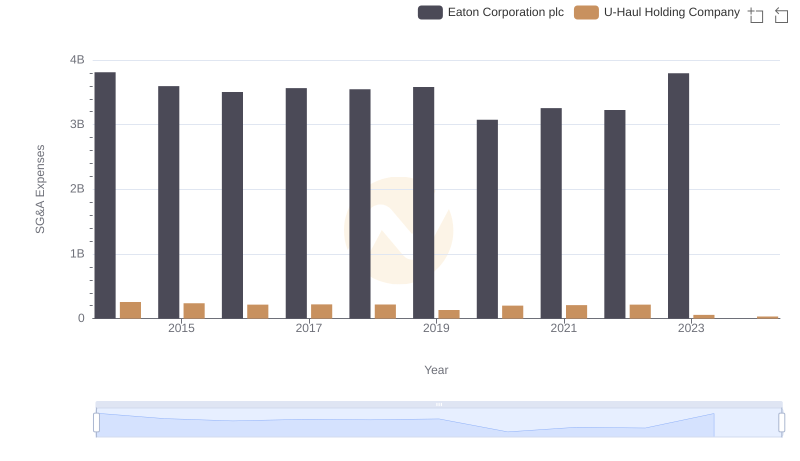
Eaton Corporation plc vs U-Haul Holding Company: SG&A Expense Trends