| __timestamp | Eaton Corporation plc | U-Haul Holding Company |
|---|---|---|
| Wednesday, January 1, 2014 | 3810000000 | 257168000 |
| Thursday, January 1, 2015 | 3596000000 | 238558000 |
| Friday, January 1, 2016 | 3505000000 | 217216000 |
| Sunday, January 1, 2017 | 3565000000 | 220053000 |
| Monday, January 1, 2018 | 3548000000 | 219271000 |
| Tuesday, January 1, 2019 | 3583000000 | 133435000 |
| Wednesday, January 1, 2020 | 3075000000 | 201718000 |
| Friday, January 1, 2021 | 3256000000 | 207982000 |
| Saturday, January 1, 2022 | 3227000000 | 216557000 |
| Sunday, January 1, 2023 | 3795000000 | 58753000 |
| Monday, January 1, 2024 | 4077000000 | 32654000 |
Infusing magic into the data realm
In the ever-evolving landscape of corporate finance, understanding the trends in Selling, General, and Administrative (SG&A) expenses is crucial for investors and analysts alike. Over the past decade, Eaton Corporation plc and U-Haul Holding Company have showcased contrasting trajectories in their SG&A expenses.
From 2014 to 2023, Eaton Corporation's SG&A expenses fluctuated, peaking in 2014 and 2023, with a notable dip in 2020. This reflects a strategic shift or external economic factors impacting their operational costs. In contrast, U-Haul's expenses have generally trended downward, with a significant reduction of approximately 77% from 2014 to 2023, indicating a potential focus on cost efficiency or restructuring.
These trends offer a window into each company's operational strategies and market adaptability, providing valuable insights for stakeholders aiming to make informed decisions.
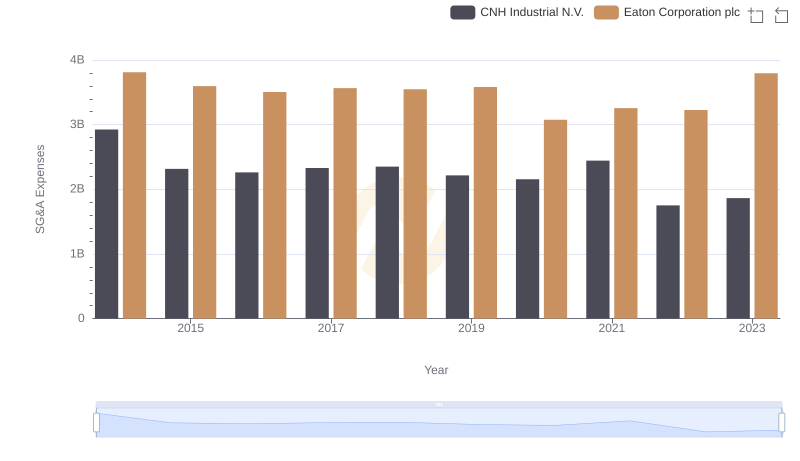
Eaton Corporation plc and CNH Industrial N.V.: SG&A Spending Patterns Compared
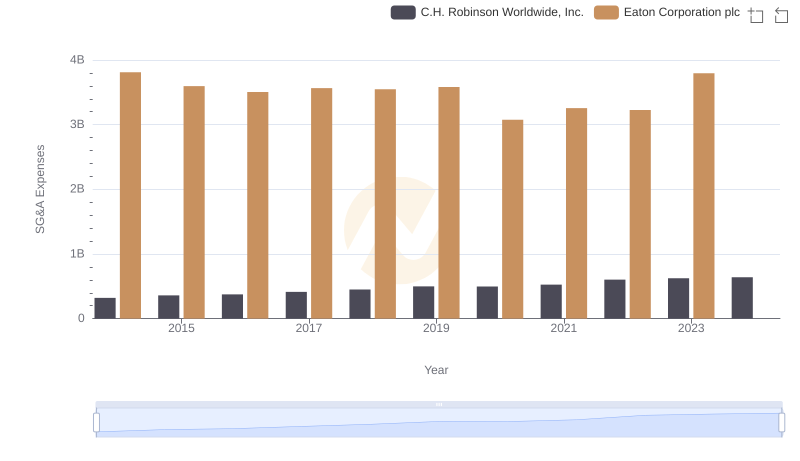
Cost Management Insights: SG&A Expenses for Eaton Corporation plc and C.H. Robinson Worldwide, Inc.
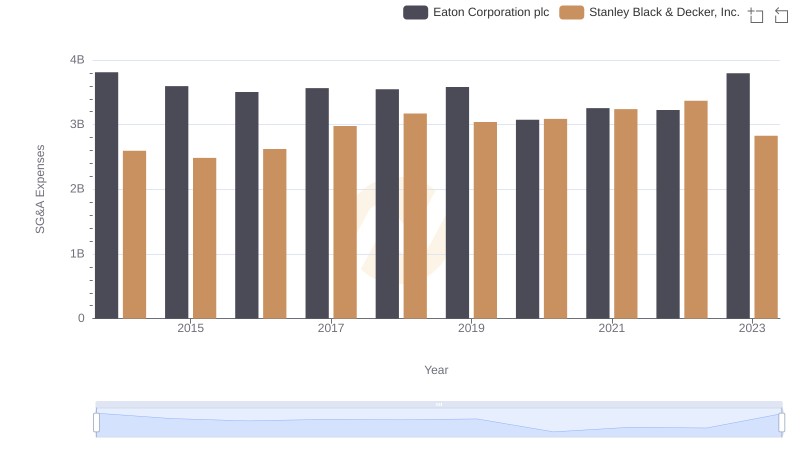
Selling, General, and Administrative Costs: Eaton Corporation plc vs Stanley Black & Decker, Inc.

Comparing SG&A Expenses: Eaton Corporation plc vs Rentokil Initial plc Trends and Insights