| __timestamp | Avery Dennison Corporation | CSX Corporation |
|---|---|---|
| Wednesday, January 1, 2014 | 6330300000 | 12669000000 |
| Thursday, January 1, 2015 | 5966900000 | 11811000000 |
| Friday, January 1, 2016 | 6086500000 | 11069000000 |
| Sunday, January 1, 2017 | 6613800000 | 11408000000 |
| Monday, January 1, 2018 | 7159000000 | 12250000000 |
| Tuesday, January 1, 2019 | 7070100000 | 11937000000 |
| Wednesday, January 1, 2020 | 6971500000 | 10583000000 |
| Friday, January 1, 2021 | 8408300000 | 12522000000 |
| Saturday, January 1, 2022 | 9039300000 | 14853000000 |
| Sunday, January 1, 2023 | 8364299999 | 14657000000 |
| Monday, January 1, 2024 | 8755700000 |
Unleashing the power of data
In the ever-evolving landscape of American industry, CSX Corporation and Avery Dennison Corporation stand as titans in their respective fields. Over the past decade, from 2014 to 2023, these companies have showcased distinct revenue trajectories. CSX Corporation, a leader in rail transportation, has consistently outperformed Avery Dennison, a global materials science company, with revenues peaking at approximately $14.9 billion in 2022. This marks a robust 40% increase from its 2016 low. Meanwhile, Avery Dennison has demonstrated steady growth, achieving a 48% rise in revenue from 2015 to 2022, reaching nearly $9 billion. Despite economic fluctuations, both companies have shown resilience, with CSX maintaining a higher revenue base, while Avery Dennison exhibits a more dynamic growth pattern. This comparison highlights the diverse strategies and market conditions influencing these industrial giants.
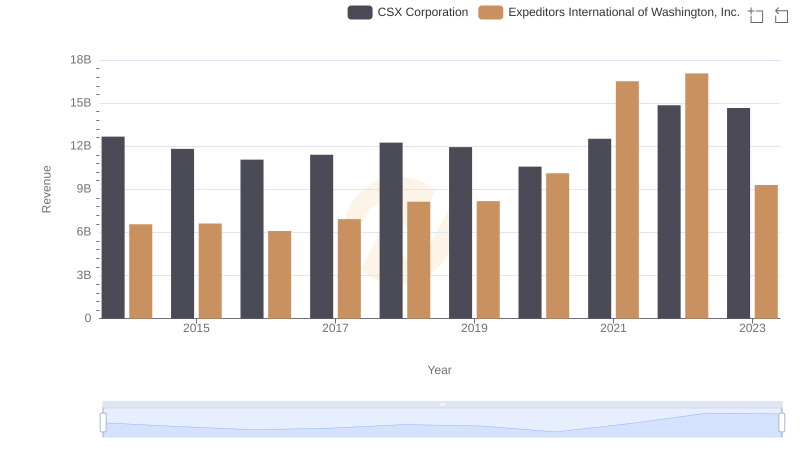
Annual Revenue Comparison: CSX Corporation vs Expeditors International of Washington, Inc.
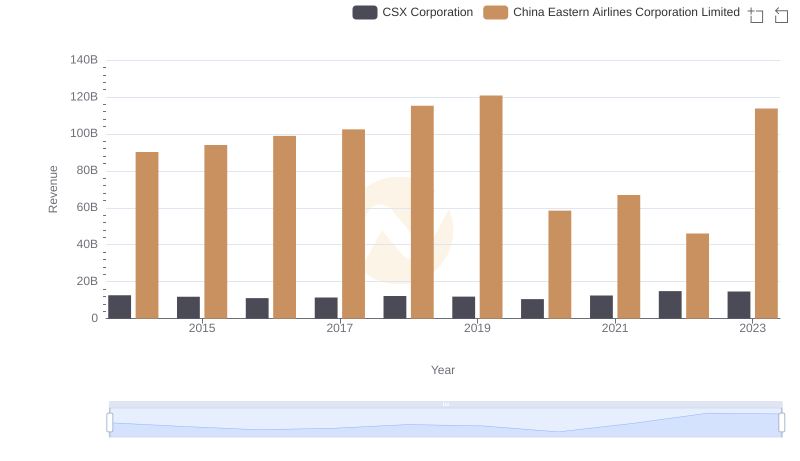
CSX Corporation and China Eastern Airlines Corporation Limited: A Comprehensive Revenue Analysis
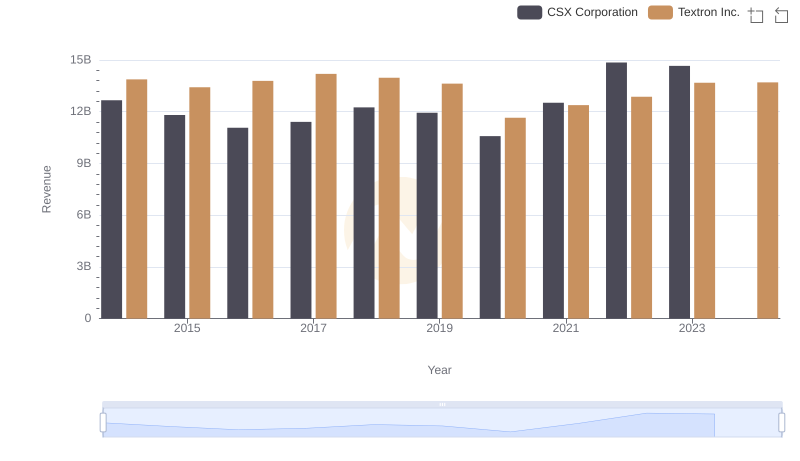
Who Generates More Revenue? CSX Corporation or Textron Inc.
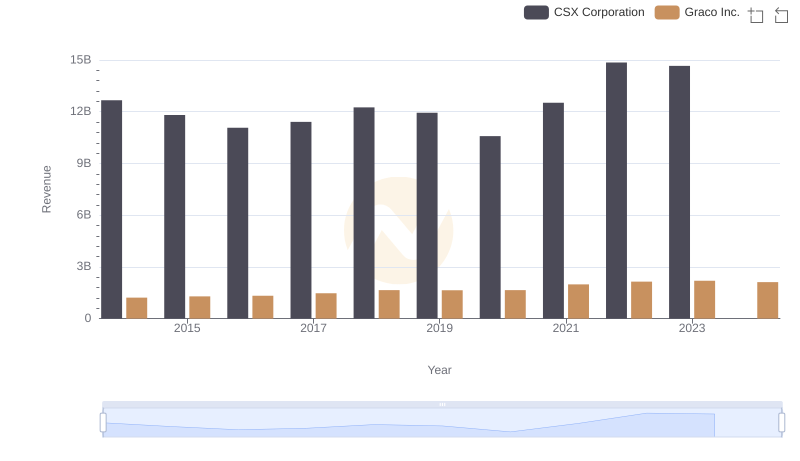
Who Generates More Revenue? CSX Corporation or Graco Inc.
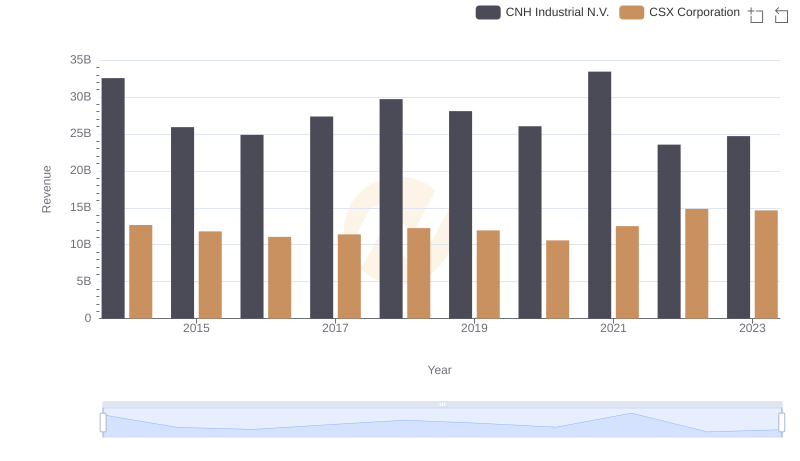
CSX Corporation vs CNH Industrial N.V.: Annual Revenue Growth Compared
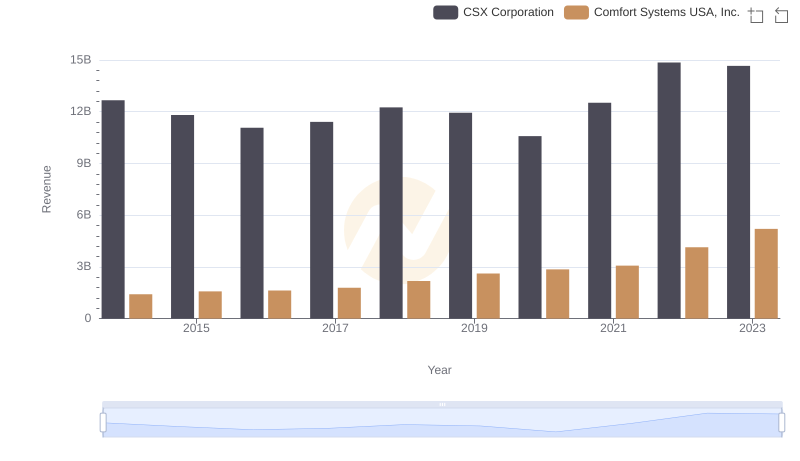
CSX Corporation and Comfort Systems USA, Inc.: A Comprehensive Revenue Analysis
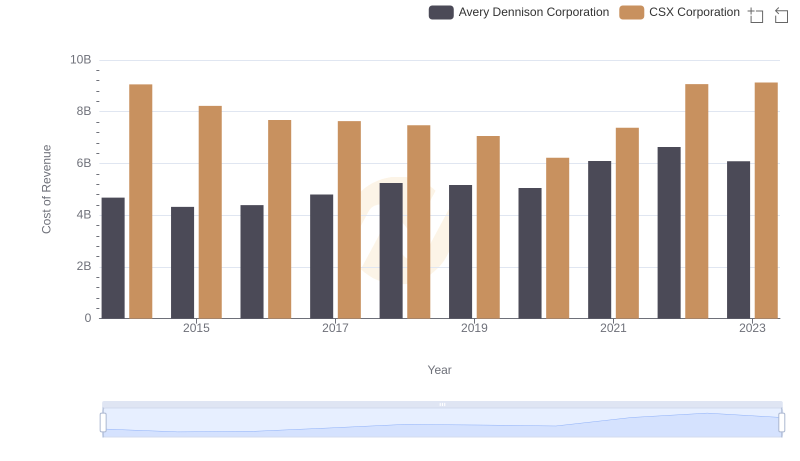
Cost of Revenue Trends: CSX Corporation vs Avery Dennison Corporation