| __timestamp | Cintas Corporation | Waste Management, Inc. |
|---|---|---|
| Wednesday, January 1, 2014 | 2637426000 | 9002000000 |
| Thursday, January 1, 2015 | 2555549000 | 8231000000 |
| Friday, January 1, 2016 | 2775588000 | 8486000000 |
| Sunday, January 1, 2017 | 2943086000 | 9021000000 |
| Monday, January 1, 2018 | 3568109000 | 9249000000 |
| Tuesday, January 1, 2019 | 3763715000 | 9496000000 |
| Wednesday, January 1, 2020 | 3851372000 | 9341000000 |
| Friday, January 1, 2021 | 3801689000 | 11111000000 |
| Saturday, January 1, 2022 | 4222213000 | 12294000000 |
| Sunday, January 1, 2023 | 4642401000 | 12606000000 |
| Monday, January 1, 2024 | 4910199000 | 13383000000 |
Igniting the spark of knowledge
In the ever-evolving landscape of corporate finance, understanding cost structures is crucial. This analysis delves into the cost of revenue trends for Waste Management, Inc. and Cintas Corporation from 2014 to 2023. Waste Management, a leader in environmental services, consistently reported higher costs, peaking at approximately $12.6 billion in 2023, reflecting a 40% increase since 2014. Meanwhile, Cintas, a prominent player in corporate uniform services, saw its costs rise by 86%, reaching nearly $4.6 billion in 2023. This stark contrast highlights differing operational scales and market dynamics. Notably, data for Waste Management in 2024 is missing, suggesting potential reporting delays or strategic shifts. As businesses navigate economic fluctuations, these insights underscore the importance of cost management in sustaining competitive advantage.
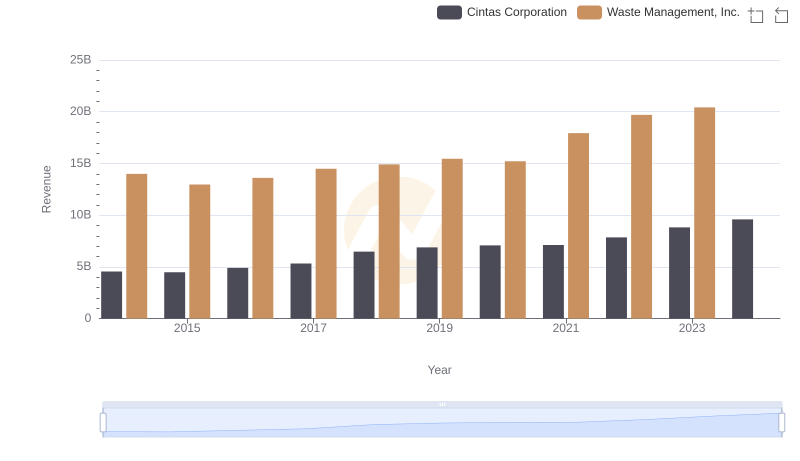
Waste Management, Inc. vs Cintas Corporation: Annual Revenue Growth Compared
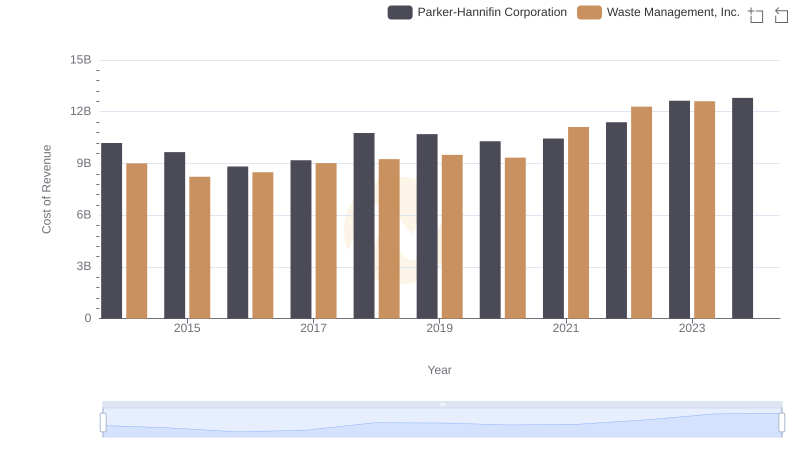
Cost Insights: Breaking Down Waste Management, Inc. and Parker-Hannifin Corporation's Expenses
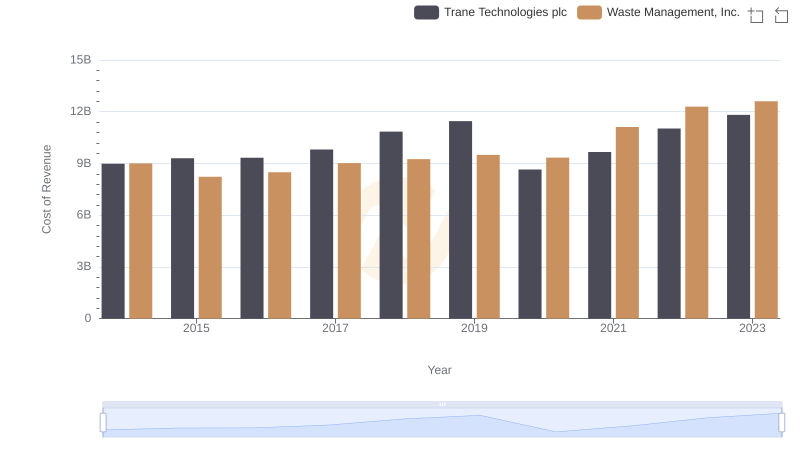
Cost of Revenue Trends: Waste Management, Inc. vs Trane Technologies plc
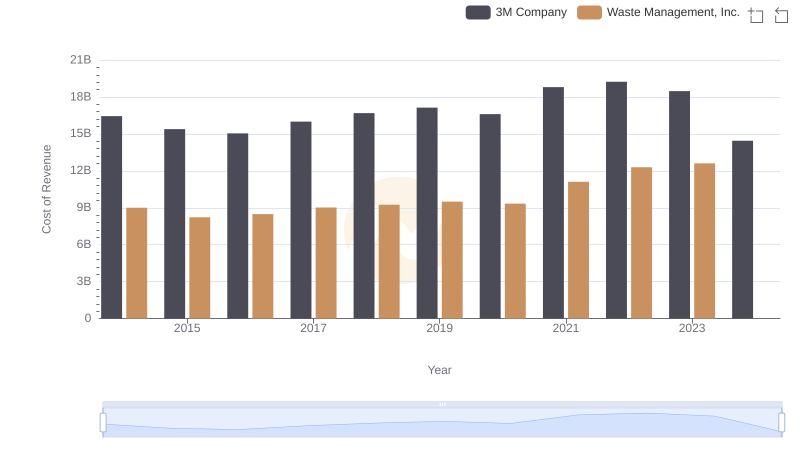
Comparing Cost of Revenue Efficiency: Waste Management, Inc. vs 3M Company
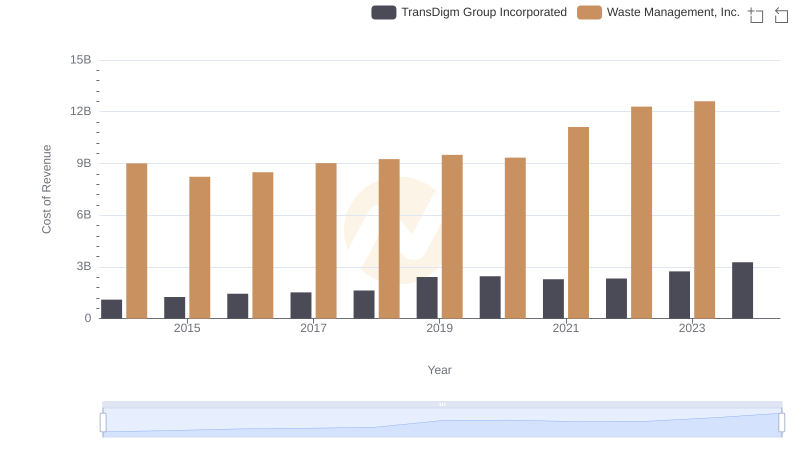
Cost of Revenue: Key Insights for Waste Management, Inc. and TransDigm Group Incorporated
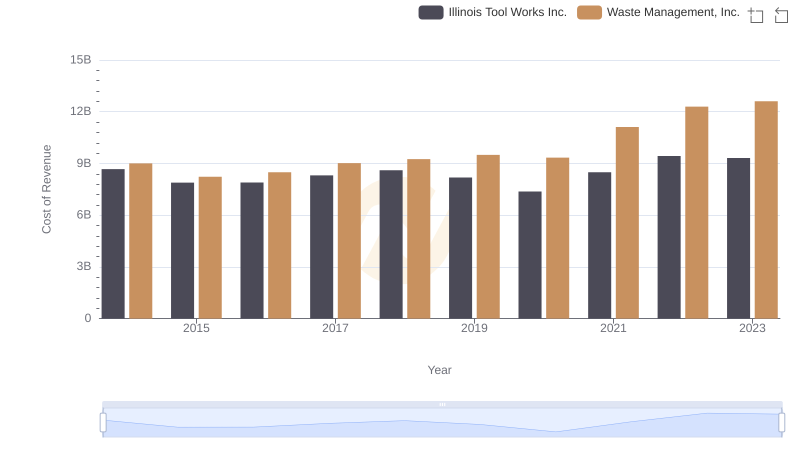
Cost Insights: Breaking Down Waste Management, Inc. and Illinois Tool Works Inc.'s Expenses
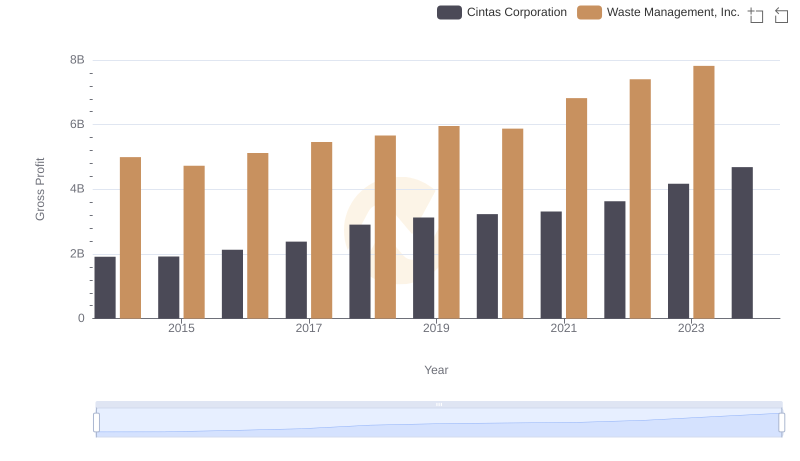
Gross Profit Comparison: Waste Management, Inc. and Cintas Corporation Trends
Comparing Cost of Revenue Efficiency: Waste Management, Inc. vs Thomson Reuters Corporation
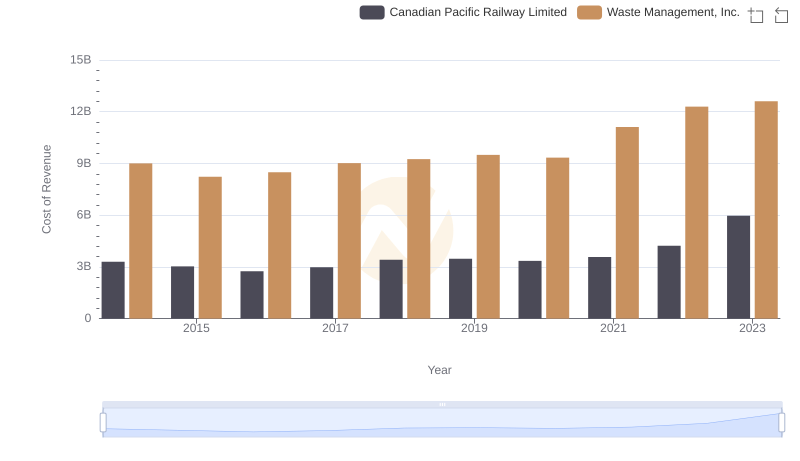
Comparing Cost of Revenue Efficiency: Waste Management, Inc. vs Canadian Pacific Railway Limited
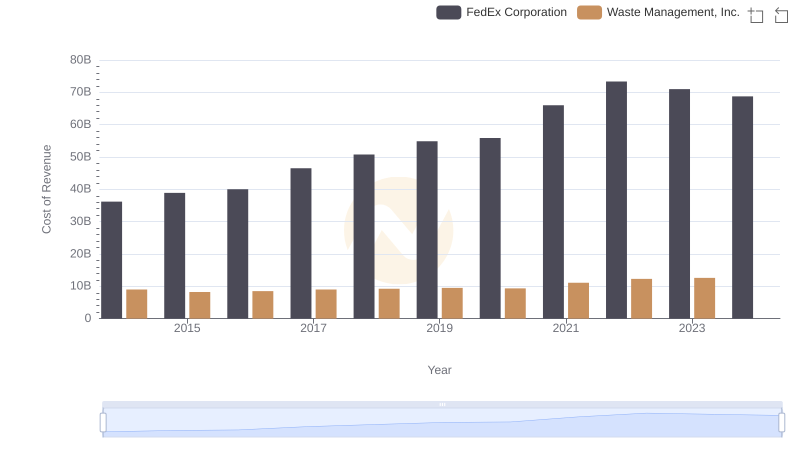
Comparing Cost of Revenue Efficiency: Waste Management, Inc. vs FedEx Corporation
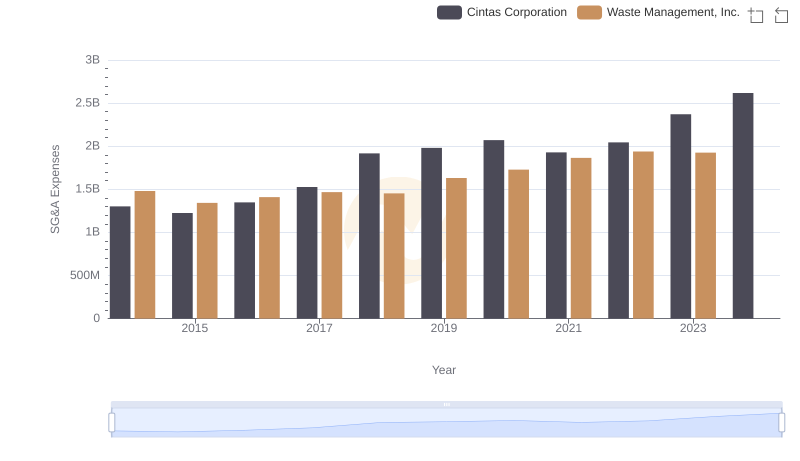
Breaking Down SG&A Expenses: Waste Management, Inc. vs Cintas Corporation