| __timestamp | Ryanair Holdings plc | United Airlines Holdings, Inc. |
|---|---|---|
| Wednesday, January 1, 2014 | 3838100000 | 29569000000 |
| Thursday, January 1, 2015 | 3999600000 | 25952000000 |
| Friday, January 1, 2016 | 4355900000 | 24856000000 |
| Sunday, January 1, 2017 | 4294000000 | 27056000000 |
| Monday, January 1, 2018 | 4512300000 | 30165000000 |
| Tuesday, January 1, 2019 | 5492800000 | 30786000000 |
| Wednesday, January 1, 2020 | 6039900000 | 20385000000 |
| Friday, January 1, 2021 | 1702700000 | 23913000000 |
| Saturday, January 1, 2022 | 4009800000 | 34315000000 |
| Sunday, January 1, 2023 | 7735000000 | 38518000000 |
| Monday, January 1, 2024 | 9566400000 | 37643000000 |
In pursuit of knowledge
In the competitive skies of the airline industry, cost management is crucial. This analysis of United Airlines Holdings, Inc. and Ryanair Holdings plc from 2014 to 2023 reveals intriguing trends. United Airlines consistently maintained a higher cost of revenue, peaking in 2023 with a 30% increase from 2020. Meanwhile, Ryanair's cost of revenue surged by over 100% from 2020 to 2023, reflecting strategic expansions and market adaptations. Notably, 2021 marked a significant dip for Ryanair, with costs plummeting by 72%, likely due to pandemic-related disruptions. As we look to 2024, Ryanair's data is available, but United Airlines' figures remain elusive, hinting at potential strategic shifts. This decade-long journey underscores the dynamic nature of the airline industry, where cost efficiency can dictate market leadership.
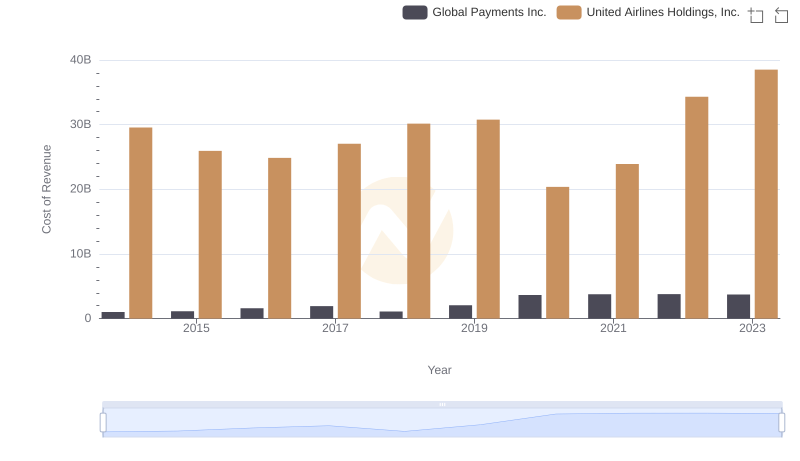
Analyzing Cost of Revenue: United Airlines Holdings, Inc. and Global Payments Inc.
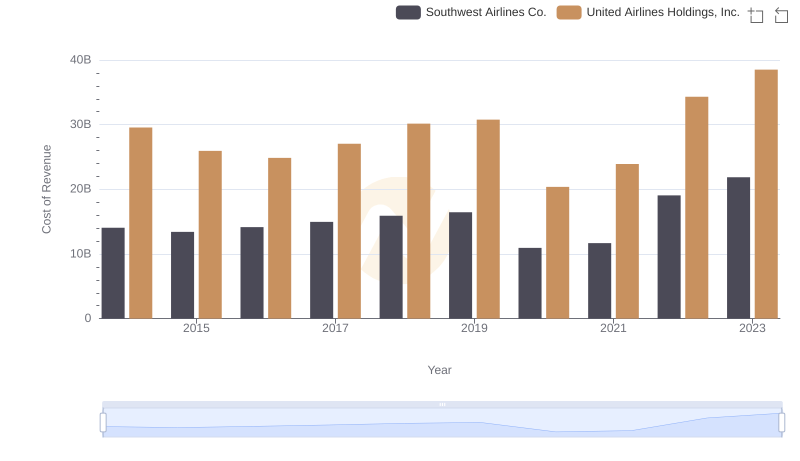
Cost of Revenue Trends: United Airlines Holdings, Inc. vs Southwest Airlines Co.
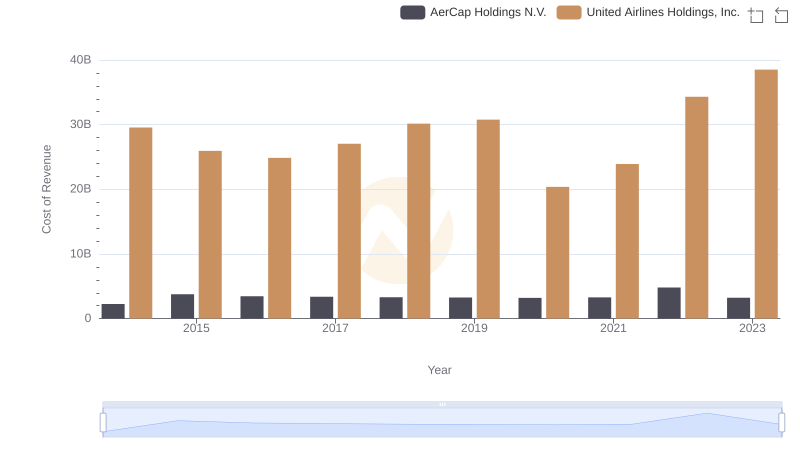
Analyzing Cost of Revenue: United Airlines Holdings, Inc. and AerCap Holdings N.V.
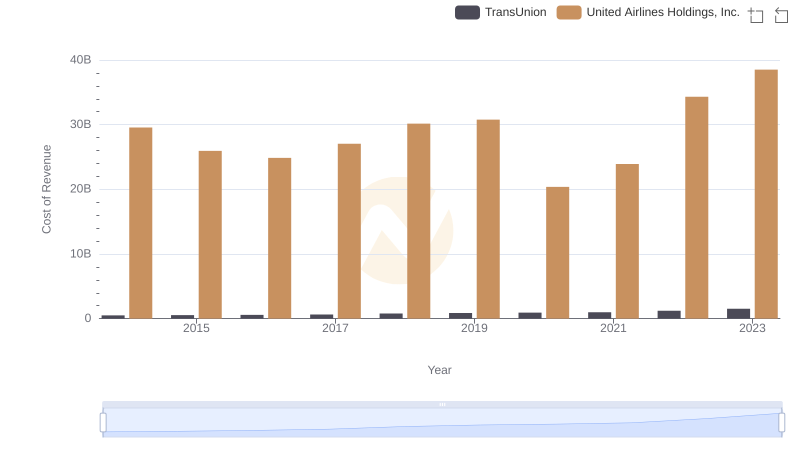
United Airlines Holdings, Inc. vs TransUnion: Efficiency in Cost of Revenue Explored
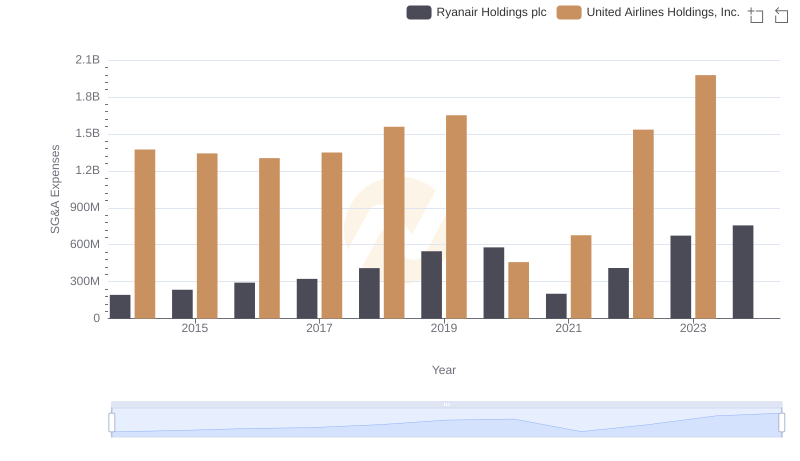
Comparing SG&A Expenses: United Airlines Holdings, Inc. vs Ryanair Holdings plc Trends and Insights