| __timestamp | Ferrovial SE | The Boeing Company |
|---|---|---|
| Wednesday, January 1, 2014 | 1131000000 | 76752000000 |
| Thursday, January 1, 2015 | 1143000000 | 82088000000 |
| Friday, January 1, 2016 | 1267000000 | 80790000000 |
| Sunday, January 1, 2017 | 1345000000 | 76066000000 |
| Monday, January 1, 2018 | 985000000 | 81490000000 |
| Tuesday, January 1, 2019 | 949000000 | 72093000000 |
| Wednesday, January 1, 2020 | 1005000000 | 63843000000 |
| Friday, January 1, 2021 | 1077000000 | 59237000000 |
| Saturday, January 1, 2022 | 1197000000 | 63078000000 |
| Sunday, January 1, 2023 | 1129000000 | 70070000000 |
| Monday, January 1, 2024 | 68508000000 |
Data in motion
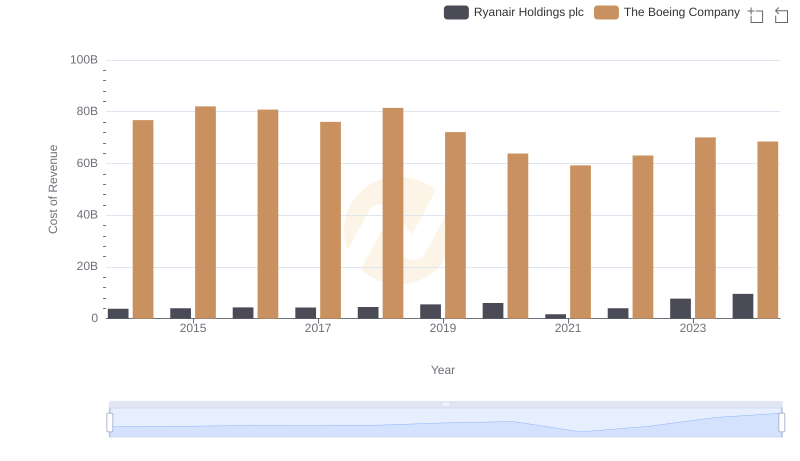
In the ever-evolving landscape of global industries, understanding cost dynamics is crucial. This analysis delves into the cost of revenue trends for two giants: The Boeing Company and Ferrovial SE, from 2014 to 2023. Boeing, a leader in aerospace, saw its cost of revenue peak in 2015, with a gradual decline of approximately 17% by 2023. This trend reflects the challenges faced by the aviation sector, including fluctuating demand and supply chain disruptions.
Conversely, Ferrovial SE, a key player in infrastructure, maintained a relatively stable cost of revenue, with a slight increase of around 5% over the same period. This stability underscores the resilience of infrastructure investments amid economic shifts. Notably, data for 2024 is incomplete, highlighting the need for ongoing analysis. These insights offer a window into the strategic financial maneuvers of these industry titans.
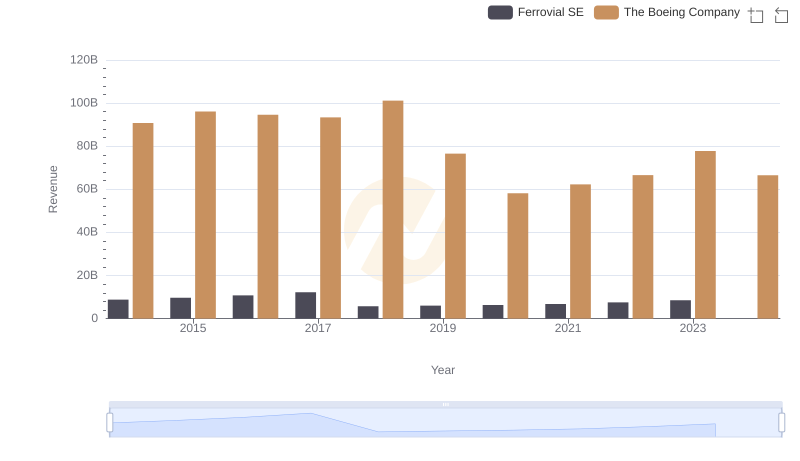
Breaking Down Revenue Trends: The Boeing Company vs Ferrovial SE
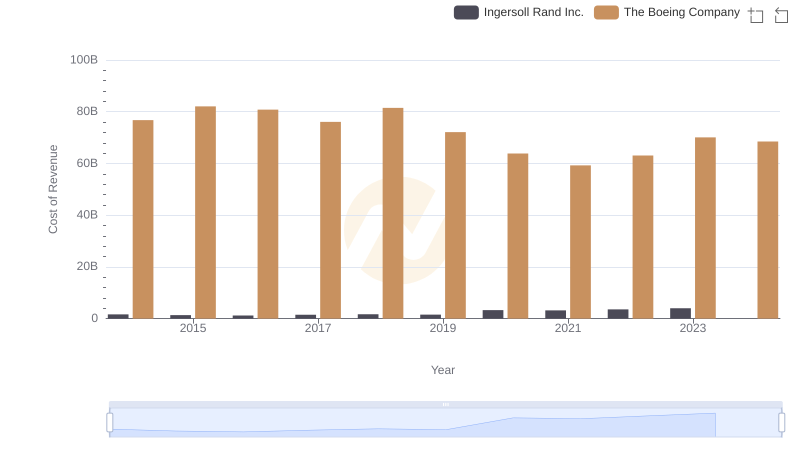
Cost of Revenue: Key Insights for The Boeing Company and Ingersoll Rand Inc.
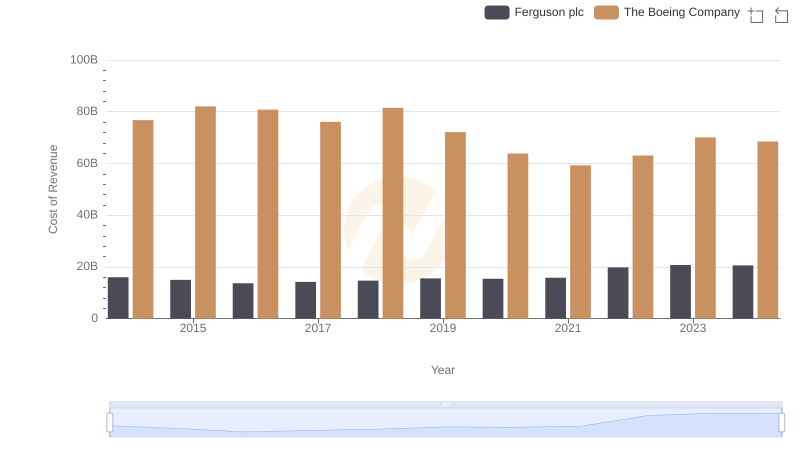
Comparing Cost of Revenue Efficiency: The Boeing Company vs Ferguson plc

The Boeing Company vs Equifax Inc.: Efficiency in Cost of Revenue Explored
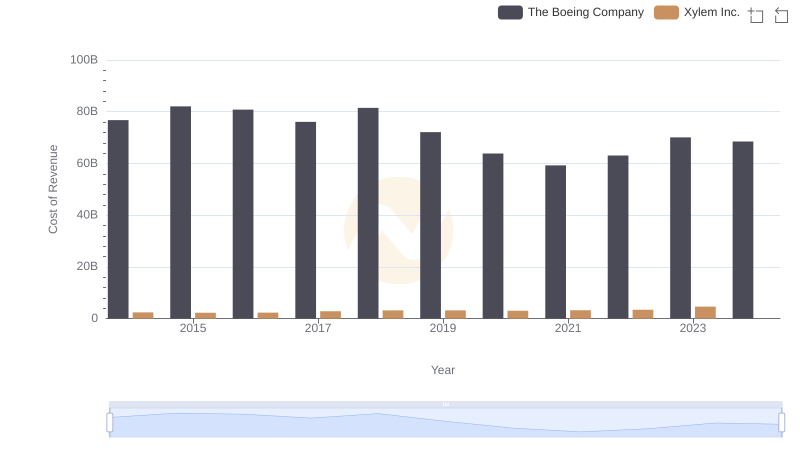
Cost of Revenue Trends: The Boeing Company vs Xylem Inc.
Cost of Revenue: Key Insights for The Boeing Company and Ryanair Holdings plc

Cost Insights: Breaking Down The Boeing Company and Builders FirstSource, Inc.'s Expenses