| __timestamp | Ferrovial SE | The Boeing Company |
|---|---|---|
| Wednesday, January 1, 2014 | 8802000000 | 90762000000 |
| Thursday, January 1, 2015 | 9699000000 | 96114000000 |
| Friday, January 1, 2016 | 10758000000 | 94571000000 |
| Sunday, January 1, 2017 | 12209000000 | 93392000000 |
| Monday, January 1, 2018 | 5737000000 | 101127000000 |
| Tuesday, January 1, 2019 | 6054000000 | 76559000000 |
| Wednesday, January 1, 2020 | 6341000000 | 58158000000 |
| Friday, January 1, 2021 | 6778000000 | 62286000000 |
| Saturday, January 1, 2022 | 7551000000 | 66608000000 |
| Sunday, January 1, 2023 | 8514000000 | 77794000000 |
| Monday, January 1, 2024 | 66517000000 |
Igniting the spark of knowledge
In the ever-evolving landscape of global industries, The Boeing Company and Ferrovial SE stand as titans in their respective fields. Over the past decade, these companies have navigated through economic turbulence and market shifts, showcasing resilience and adaptability.
From 2014 to 2023, Boeing's revenue trajectory reveals a rollercoaster ride, peaking in 2018 with a 10% increase from the previous year, only to face a significant dip in 2019 and 2020, reflecting the broader challenges in the aerospace sector. However, a steady recovery is evident, with a 34% rise by 2023.
Conversely, Ferrovial SE, a leader in infrastructure, has demonstrated a more stable growth pattern. Despite a notable dip in 2018, the company rebounded, achieving a 48% increase in revenue by 2023. This comparison highlights the contrasting dynamics and resilience strategies of these industry leaders.
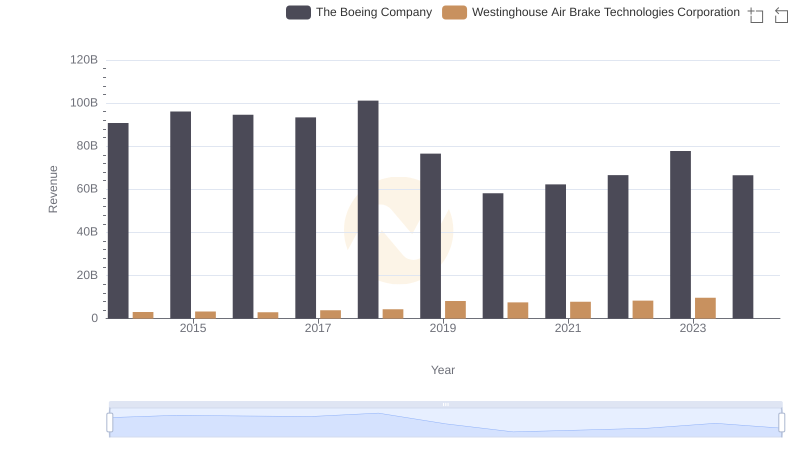
Revenue Showdown: The Boeing Company vs Westinghouse Air Brake Technologies Corporation
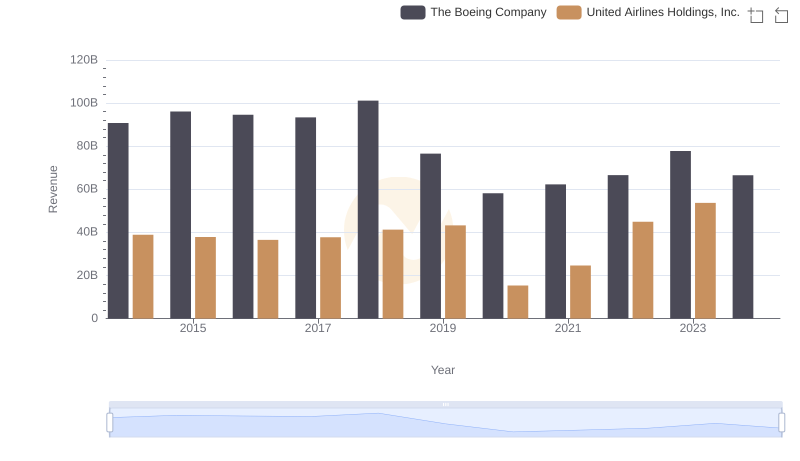
Comparing Revenue Performance: The Boeing Company or United Airlines Holdings, Inc.?
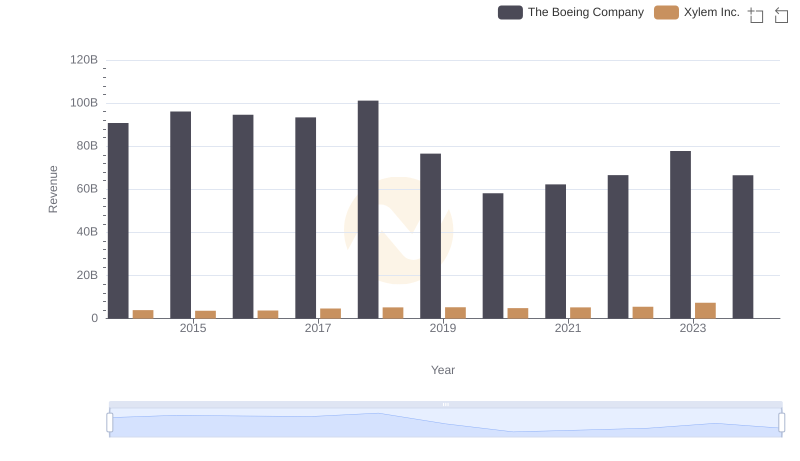
Annual Revenue Comparison: The Boeing Company vs Xylem Inc.
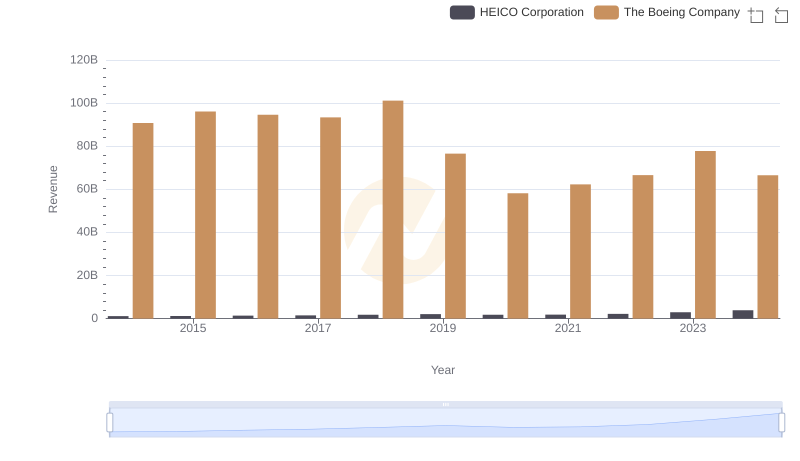
Revenue Showdown: The Boeing Company vs HEICO Corporation
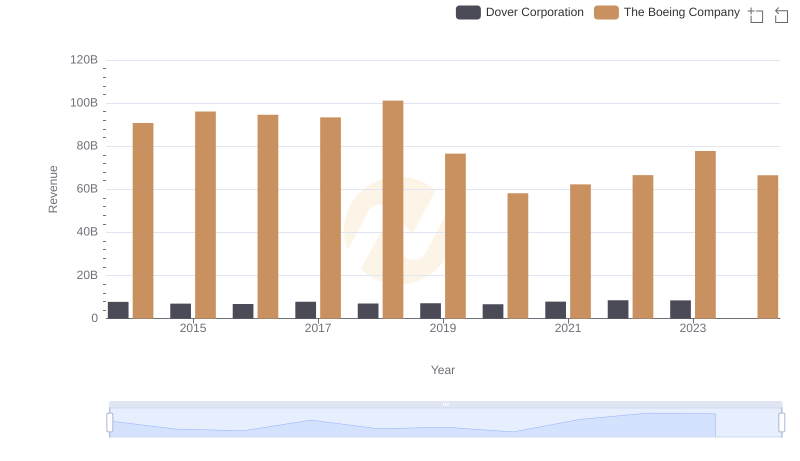
The Boeing Company and Dover Corporation: A Comprehensive Revenue Analysis
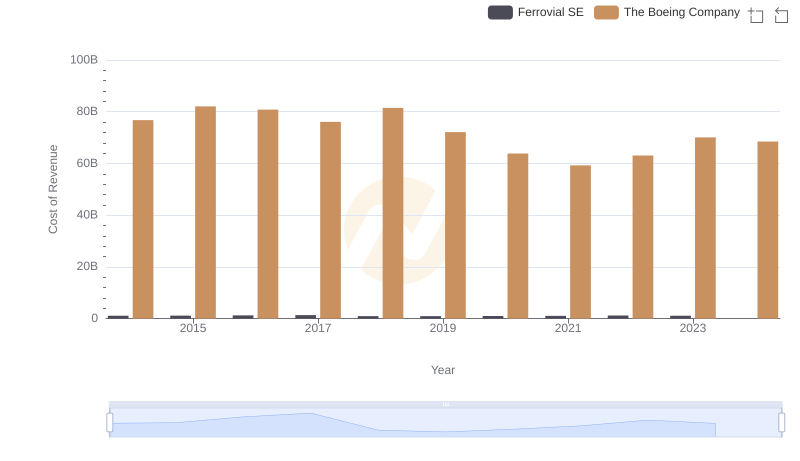
Cost of Revenue Trends: The Boeing Company vs Ferrovial SE
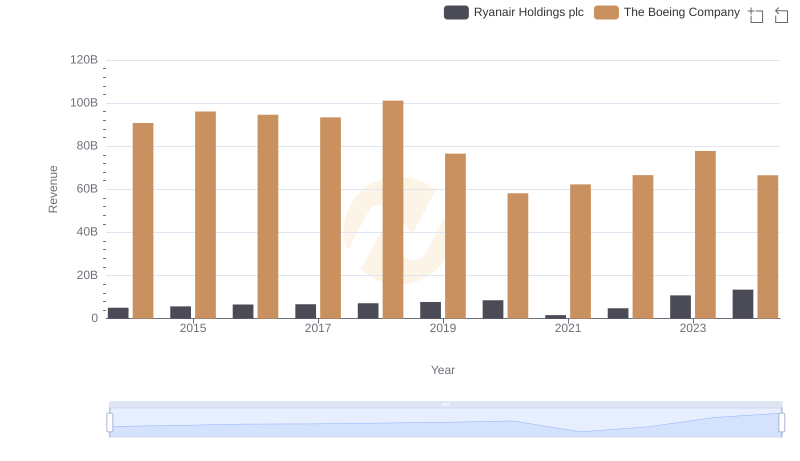
Who Generates More Revenue? The Boeing Company or Ryanair Holdings plc
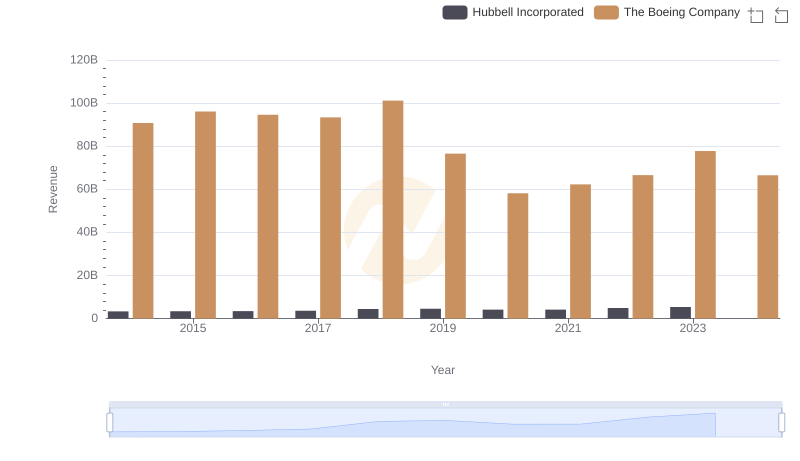
Who Generates More Revenue? The Boeing Company or Hubbell Incorporated