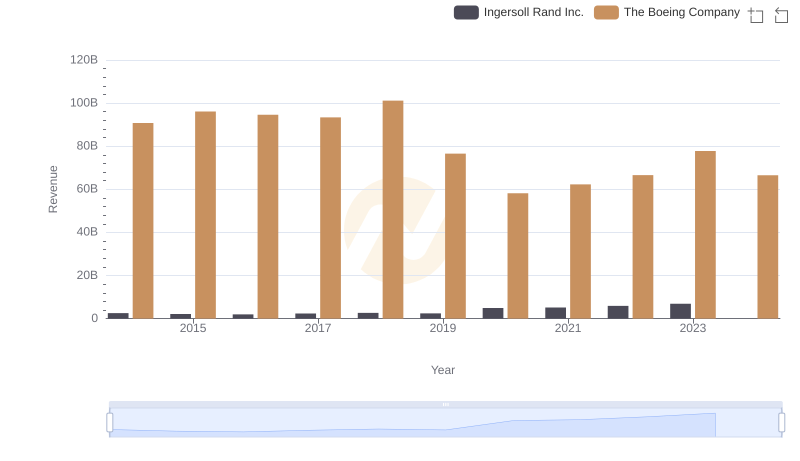
| __timestamp | Ingersoll Rand Inc. | The Boeing Company |
|---|---|---|
| Wednesday, January 1, 2014 | 1633224000 | 76752000000 |
| Thursday, January 1, 2015 | 1347800000 | 82088000000 |
| Friday, January 1, 2016 | 1222705000 | 80790000000 |
| Sunday, January 1, 2017 | 1477500000 | 76066000000 |
| Monday, January 1, 2018 | 1677300000 | 81490000000 |
| Tuesday, January 1, 2019 | 1540200000 | 72093000000 |
| Wednesday, January 1, 2020 | 3296800000 | 63843000000 |
| Friday, January 1, 2021 | 3163900000 | 59237000000 |
| Saturday, January 1, 2022 | 3590700000 | 63078000000 |
| Sunday, January 1, 2023 | 3993900000 | 70070000000 |
| Monday, January 1, 2024 | 0 | 68508000000 |
Unlocking the unknown
In the ever-evolving landscape of aerospace and industrial manufacturing, understanding cost dynamics is crucial. From 2014 to 2023, The Boeing Company and Ingersoll Rand Inc. have showcased distinct trends in their cost of revenue. Boeing, a titan in aerospace, saw its cost of revenue peak in 2015, with a gradual decline of approximately 17% by 2023. This reflects strategic cost management amidst industry challenges. In contrast, Ingersoll Rand, a leader in industrial solutions, experienced a significant rise in costs, nearly tripling from 2014 to 2023. This surge, particularly post-2020, highlights the company's expansion and adaptation to market demands. Notably, 2024 data for Ingersoll Rand remains unavailable, indicating potential shifts or reporting delays. These insights underscore the dynamic nature of cost management in these sectors, offering a window into strategic financial planning.
Who Generates More Revenue? The Boeing Company or Ingersoll Rand Inc.
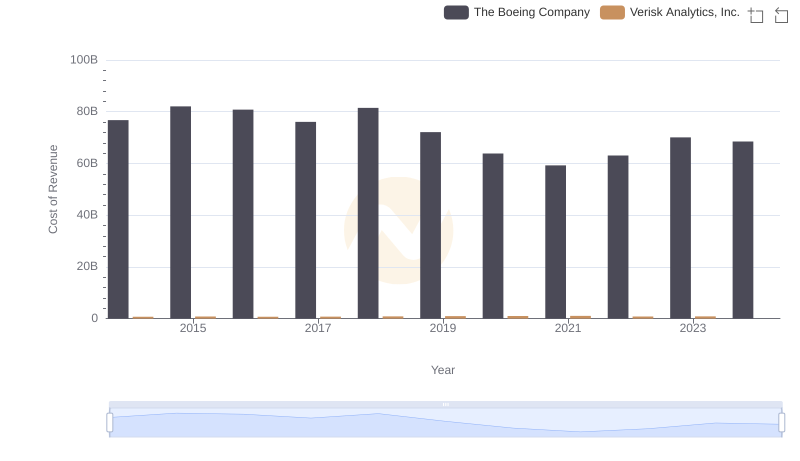
The Boeing Company vs Verisk Analytics, Inc.: Efficiency in Cost of Revenue Explored
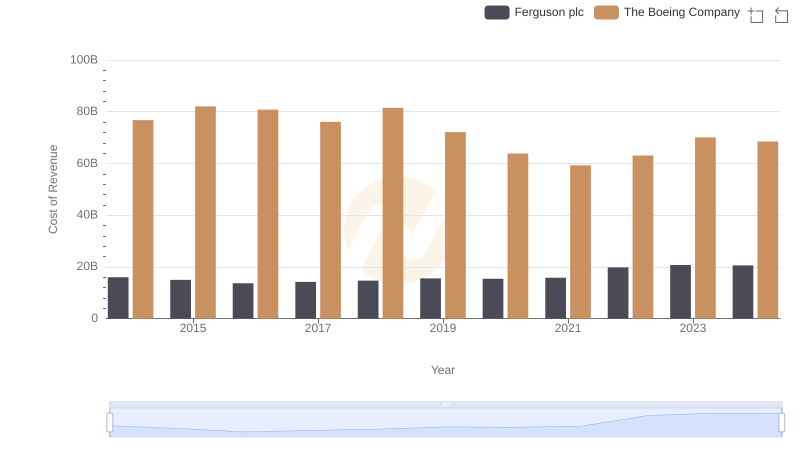
Comparing Cost of Revenue Efficiency: The Boeing Company vs Ferguson plc

The Boeing Company vs Equifax Inc.: Efficiency in Cost of Revenue Explored
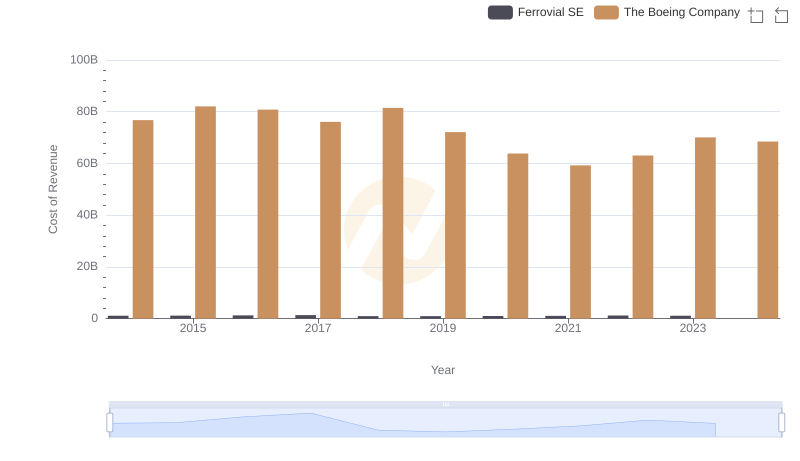
Cost of Revenue Trends: The Boeing Company vs Ferrovial SE
SG&A Efficiency Analysis: Comparing The Boeing Company and Ingersoll Rand Inc.