| __timestamp | Builders FirstSource, Inc. | The Boeing Company |
|---|---|---|
| Wednesday, January 1, 2014 | 1247099000 | 76752000000 |
| Thursday, January 1, 2015 | 2662967000 | 82088000000 |
| Friday, January 1, 2016 | 4770536000 | 80790000000 |
| Sunday, January 1, 2017 | 5306818000 | 76066000000 |
| Monday, January 1, 2018 | 5801831000 | 81490000000 |
| Tuesday, January 1, 2019 | 5303602000 | 72093000000 |
| Wednesday, January 1, 2020 | 6336290000 | 63843000000 |
| Friday, January 1, 2021 | 14042900000 | 59237000000 |
| Saturday, January 1, 2022 | 14982039000 | 63078000000 |
| Sunday, January 1, 2023 | 11084996000 | 70070000000 |
| Monday, January 1, 2024 | 68508000000 |
Infusing magic into the data realm
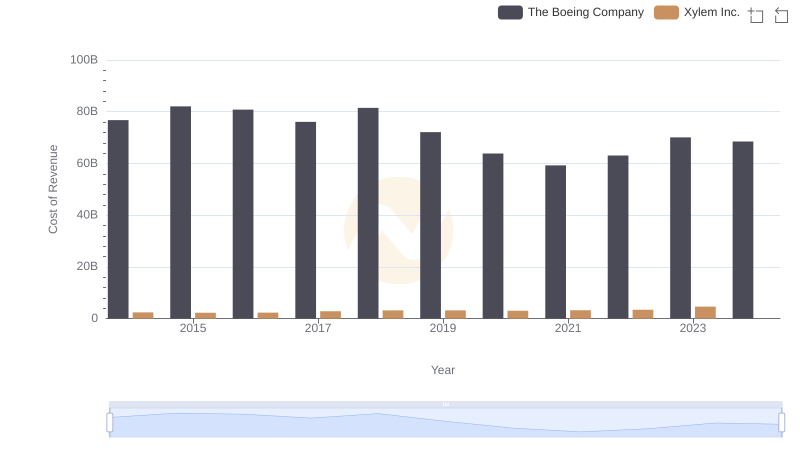
In the ever-evolving landscape of corporate expenses, understanding the cost dynamics of industry giants like The Boeing Company and Builders FirstSource, Inc. offers valuable insights. Over the past decade, Boeing's cost of revenue has shown a notable decline, dropping approximately 9% from its peak in 2015. This trend reflects the company's strategic adjustments in response to market challenges and operational efficiencies.
Conversely, Builders FirstSource, Inc. has experienced a remarkable surge in its cost of revenue, increasing by over 800% from 2014 to 2023. This growth mirrors the company's expansion and increased market demand in the construction sector. Notably, 2021 marked a significant spike, with costs nearly doubling from the previous year, highlighting a period of rapid growth.
While Boeing's costs have stabilized in recent years, Builders FirstSource continues to navigate a dynamic market, with 2023 showing a slight decrease from the previous year. These trends underscore the contrasting strategies and market conditions faced by these two industry leaders.