| __timestamp | Equifax Inc. | Ingersoll Rand Inc. |
|---|---|---|
| Wednesday, January 1, 2014 | 844700000 | 1633224000 |
| Thursday, January 1, 2015 | 887400000 | 1347800000 |
| Friday, January 1, 2016 | 1113400000 | 1222705000 |
| Sunday, January 1, 2017 | 1210700000 | 1477500000 |
| Monday, January 1, 2018 | 1440400000 | 1677300000 |
| Tuesday, January 1, 2019 | 1521700000 | 1540200000 |
| Wednesday, January 1, 2020 | 1737400000 | 3296800000 |
| Friday, January 1, 2021 | 1980900000 | 3163900000 |
| Saturday, January 1, 2022 | 2177200000 | 3590700000 |
| Sunday, January 1, 2023 | 2335100000 | 3993900000 |
| Monday, January 1, 2024 | 0 | 0 |
Unveiling the hidden dimensions of data
In the ever-evolving landscape of corporate finance, understanding cost structures is crucial. This analysis delves into the cost of revenue trends for Ingersoll Rand Inc. and Equifax Inc. from 2014 to 2023. Over this period, Ingersoll Rand Inc. saw a remarkable increase of approximately 145% in its cost of revenue, peaking at nearly $4 billion in 2023. This surge reflects strategic investments and operational expansions. Meanwhile, Equifax Inc. experienced a steady rise of around 176%, reaching over $2.3 billion in 2023. This growth underscores its commitment to enhancing data security and analytics capabilities. Notably, both companies faced significant cost increases in 2020, likely due to pandemic-related challenges. These insights highlight the dynamic nature of cost management in response to market demands and external pressures.
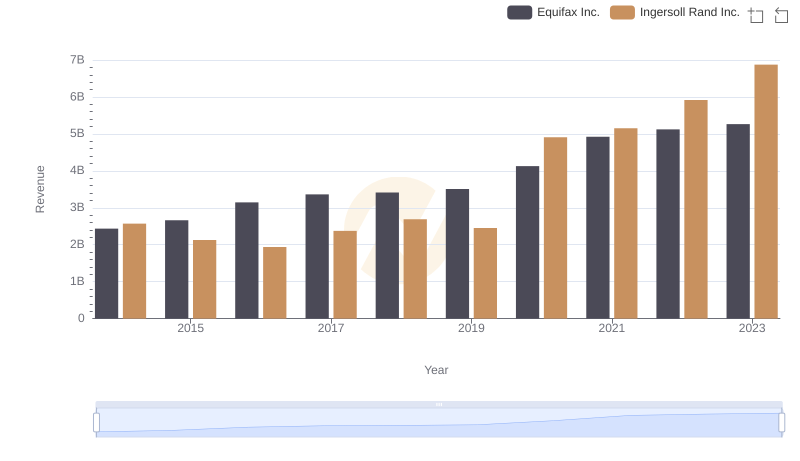
Ingersoll Rand Inc. vs Equifax Inc.: Examining Key Revenue Metrics
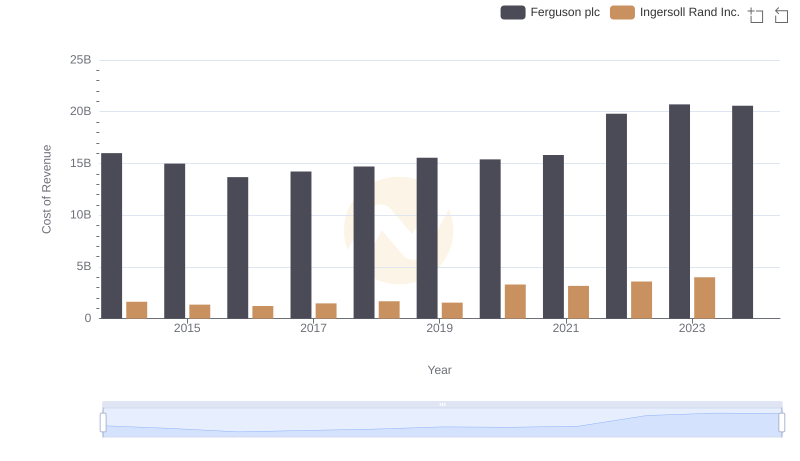
Analyzing Cost of Revenue: Ingersoll Rand Inc. and Ferguson plc
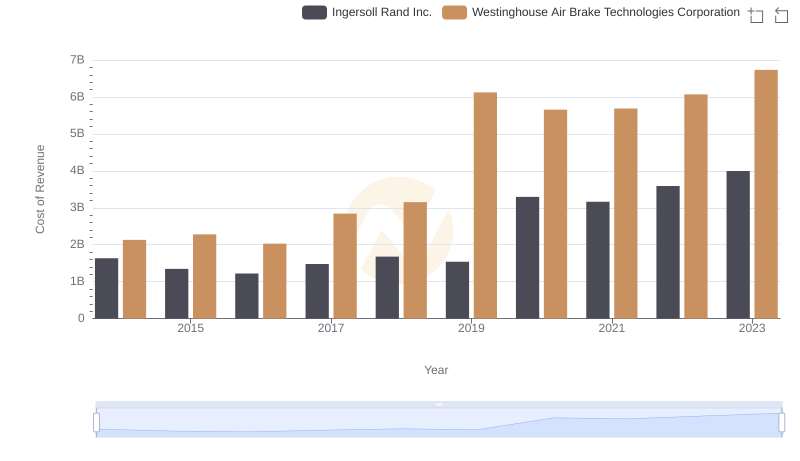
Cost of Revenue Comparison: Ingersoll Rand Inc. vs Westinghouse Air Brake Technologies Corporation
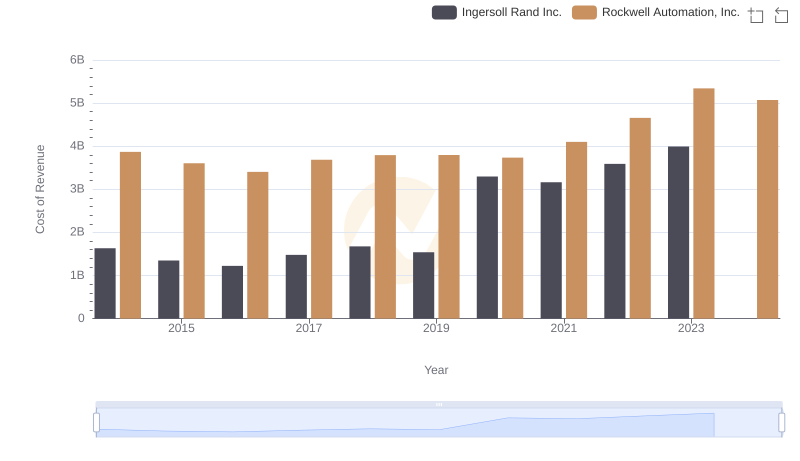
Cost of Revenue Trends: Ingersoll Rand Inc. vs Rockwell Automation, Inc.
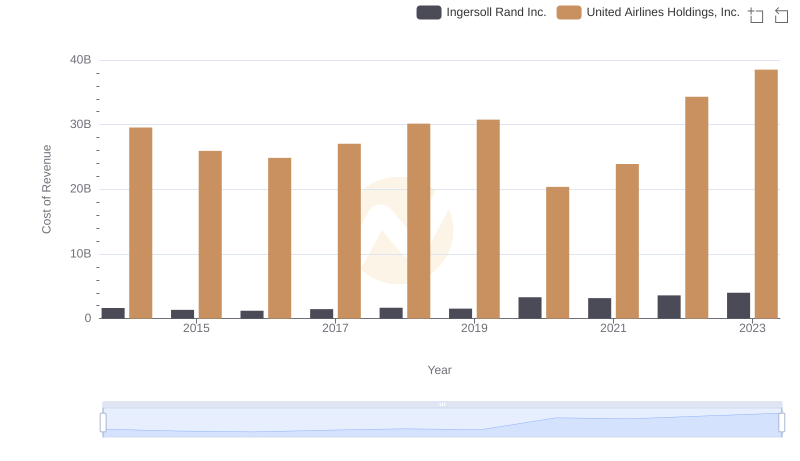
Cost Insights: Breaking Down Ingersoll Rand Inc. and United Airlines Holdings, Inc.'s Expenses
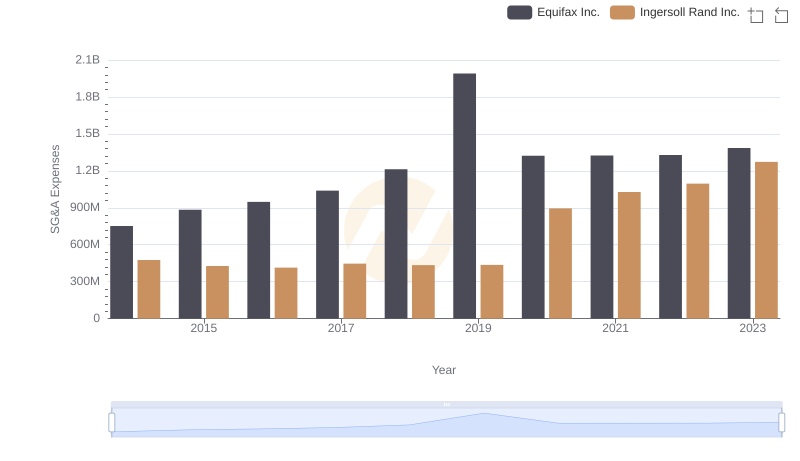
Ingersoll Rand Inc. or Equifax Inc.: Who Manages SG&A Costs Better?