| __timestamp | Ingersoll Rand Inc. | Westinghouse Air Brake Technologies Corporation |
|---|---|---|
| Wednesday, January 1, 2014 | 1633224000 | 2130920000 |
| Thursday, January 1, 2015 | 1347800000 | 2281845000 |
| Friday, January 1, 2016 | 1222705000 | 2029647000 |
| Sunday, January 1, 2017 | 1477500000 | 2841159000 |
| Monday, January 1, 2018 | 1677300000 | 3151816000 |
| Tuesday, January 1, 2019 | 1540200000 | 6122400000 |
| Wednesday, January 1, 2020 | 3296800000 | 5657400000 |
| Friday, January 1, 2021 | 3163900000 | 5687000000 |
| Saturday, January 1, 2022 | 3590700000 | 6070000000 |
| Sunday, January 1, 2023 | 3993900000 | 6733000000 |
| Monday, January 1, 2024 | 0 | 7021000000 |
Unveiling the hidden dimensions of data
In the competitive landscape of industrial manufacturing, Ingersoll Rand Inc. and Westinghouse Air Brake Technologies Corporation have been pivotal players. Over the past decade, from 2014 to 2023, these companies have shown significant shifts in their cost of revenue. Ingersoll Rand Inc. started with a cost of revenue of approximately $1.63 billion in 2014, which surged by over 145% to nearly $4 billion by 2023. Meanwhile, Westinghouse Air Brake Technologies Corporation saw a similar upward trajectory, with costs rising from around $2.13 billion in 2014 to $6.73 billion in 2023, marking an increase of over 215%. This data highlights the growing operational expenses these companies face, reflecting broader industry trends and economic conditions. As these giants continue to evolve, understanding their financial dynamics offers valuable insights into the industrial sector's future.
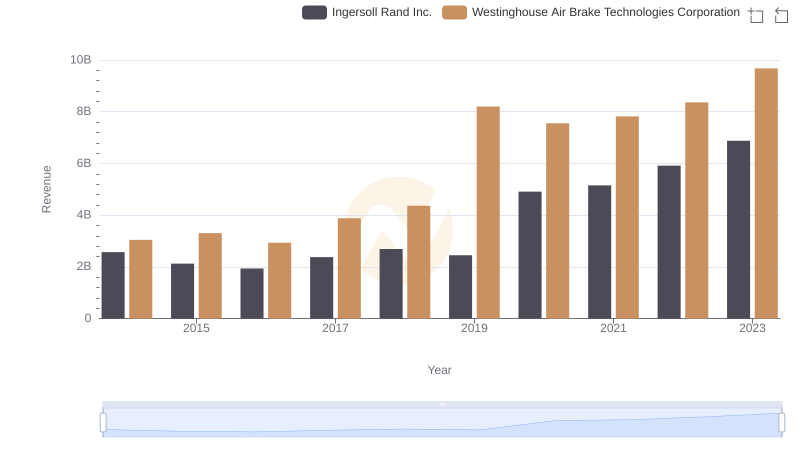
Revenue Insights: Ingersoll Rand Inc. and Westinghouse Air Brake Technologies Corporation Performance Compared
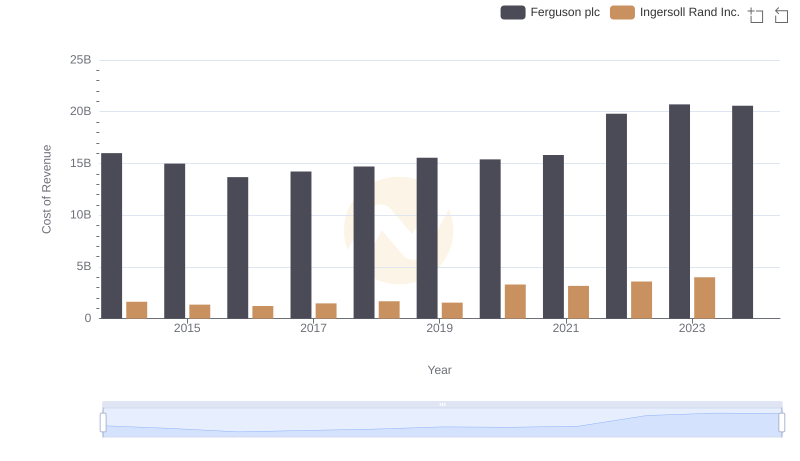
Analyzing Cost of Revenue: Ingersoll Rand Inc. and Ferguson plc
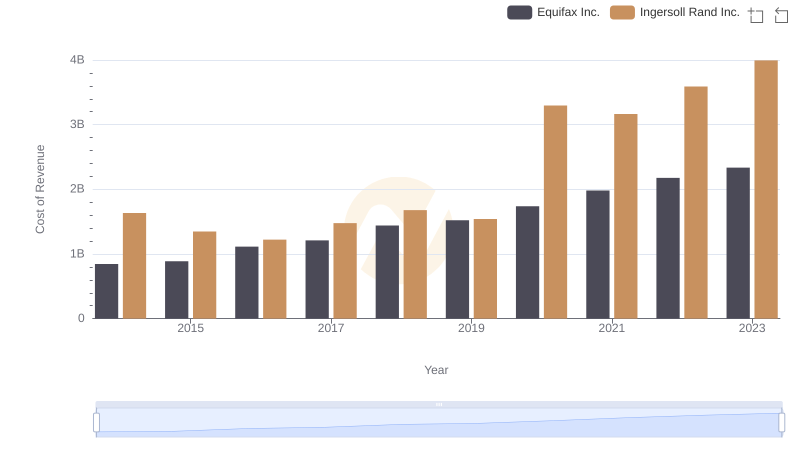
Cost of Revenue: Key Insights for Ingersoll Rand Inc. and Equifax Inc.
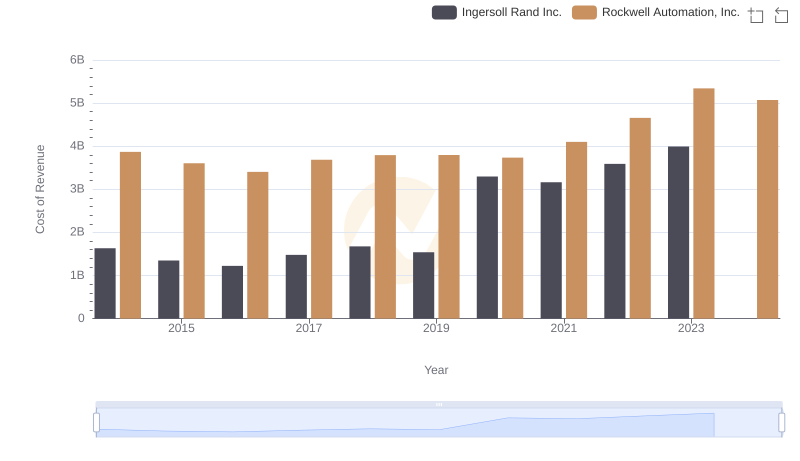
Cost of Revenue Trends: Ingersoll Rand Inc. vs Rockwell Automation, Inc.
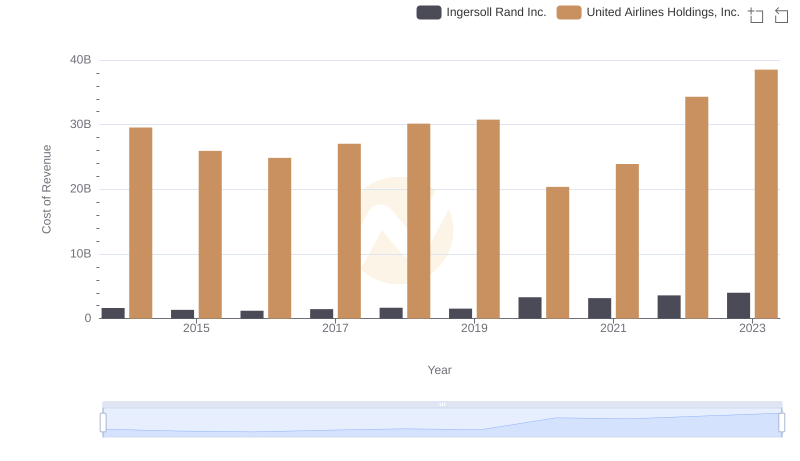
Cost Insights: Breaking Down Ingersoll Rand Inc. and United Airlines Holdings, Inc.'s Expenses
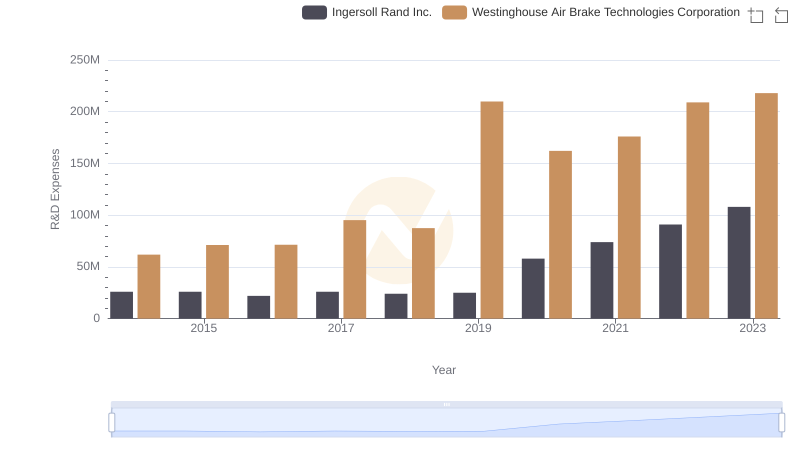
Research and Development Expenses Breakdown: Ingersoll Rand Inc. vs Westinghouse Air Brake Technologies Corporation
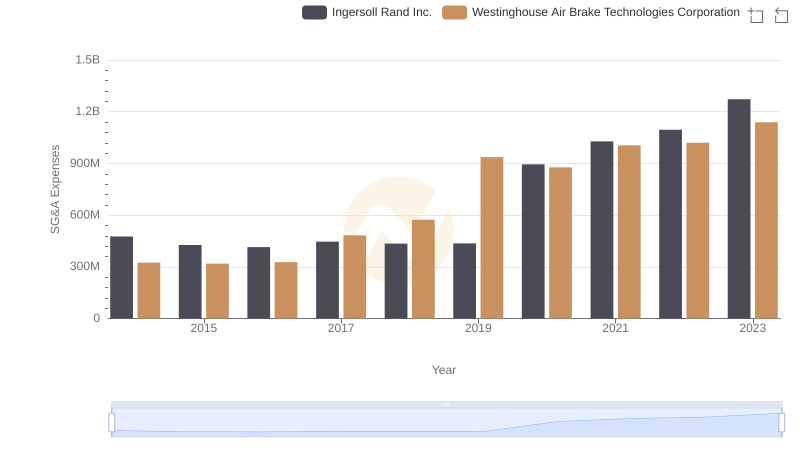
Comparing SG&A Expenses: Ingersoll Rand Inc. vs Westinghouse Air Brake Technologies Corporation Trends and Insights