| __timestamp | Equifax Inc. | J.B. Hunt Transport Services, Inc. |
|---|---|---|
| Wednesday, January 1, 2014 | 844700000 | 5124095000 |
| Thursday, January 1, 2015 | 887400000 | 5041472000 |
| Friday, January 1, 2016 | 1113400000 | 5369826000 |
| Sunday, January 1, 2017 | 1210700000 | 5990275000 |
| Monday, January 1, 2018 | 1440400000 | 7255657000 |
| Tuesday, January 1, 2019 | 1521700000 | 7659003000 |
| Wednesday, January 1, 2020 | 1737400000 | 8186697000 |
| Friday, January 1, 2021 | 1980900000 | 10298483000 |
| Saturday, January 1, 2022 | 2177200000 | 12341472000 |
| Sunday, January 1, 2023 | 2335100000 | 10433277000 |
| Monday, January 1, 2024 | 0 |
Unlocking the unknown
In the ever-evolving landscape of corporate finance, understanding cost structures is crucial. This analysis delves into the cost of revenue trends for Equifax Inc. and J.B. Hunt Transport Services, Inc. from 2014 to 2023. Over this period, Equifax's cost of revenue increased by approximately 176%, starting from $844 million in 2014 to $2.34 billion in 2023. Meanwhile, J.B. Hunt's cost of revenue surged by 104%, from $5.12 billion to $10.43 billion.
These trends highlight the dynamic nature of cost management in different industries, offering valuable insights for investors and analysts alike.
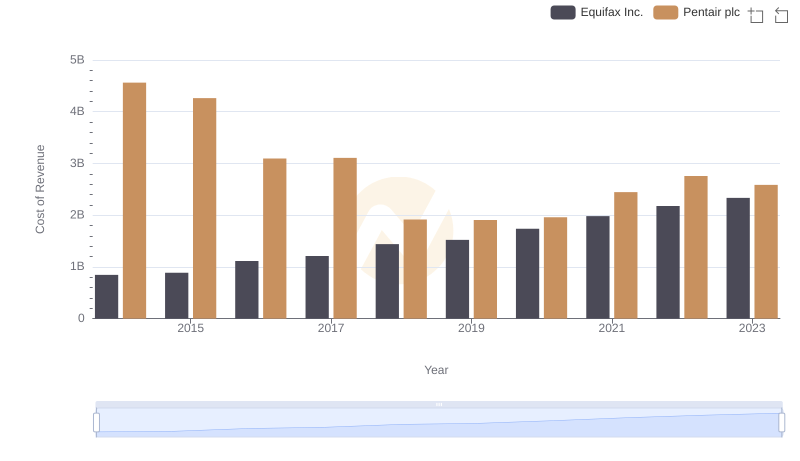
Analyzing Cost of Revenue: Equifax Inc. and Pentair plc
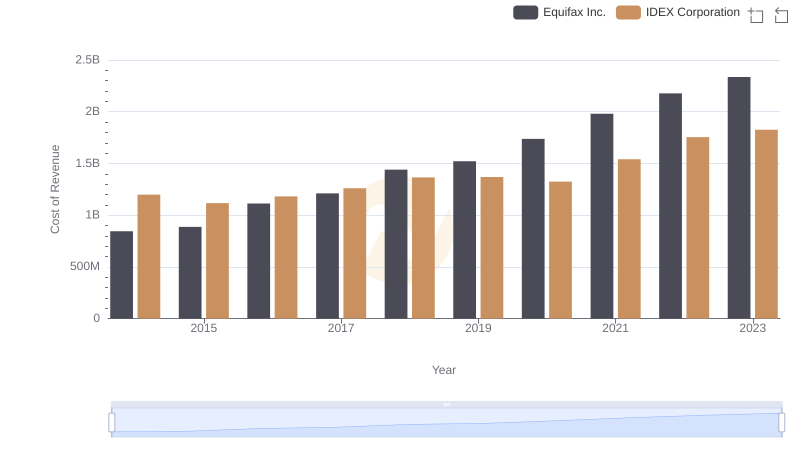
Cost Insights: Breaking Down Equifax Inc. and IDEX Corporation's Expenses
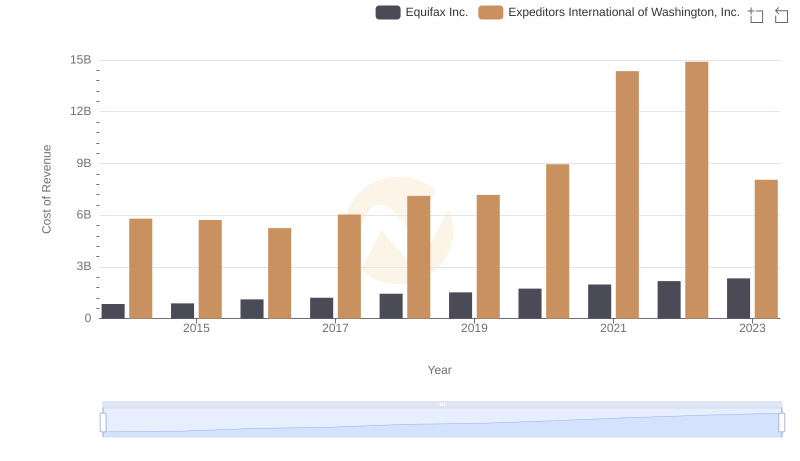
Cost of Revenue: Key Insights for Equifax Inc. and Expeditors International of Washington, Inc.
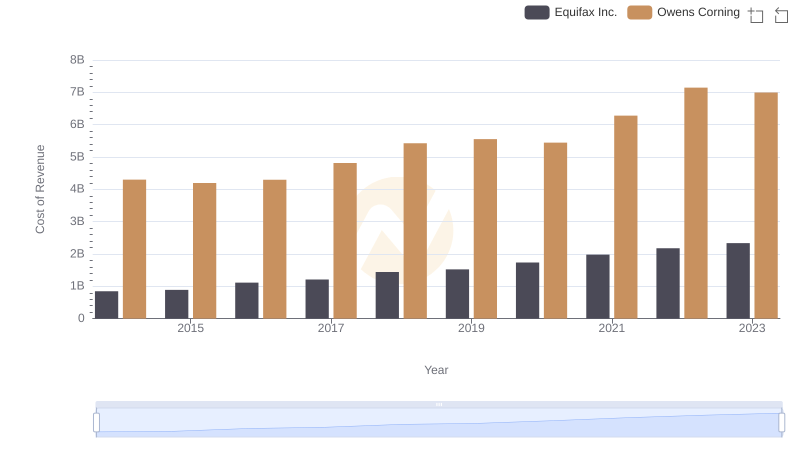
Cost of Revenue Trends: Equifax Inc. vs Owens Corning
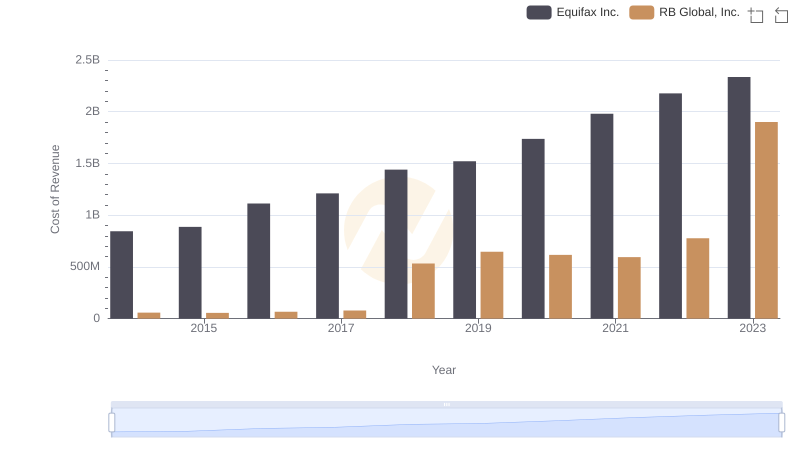
Cost Insights: Breaking Down Equifax Inc. and RB Global, Inc.'s Expenses
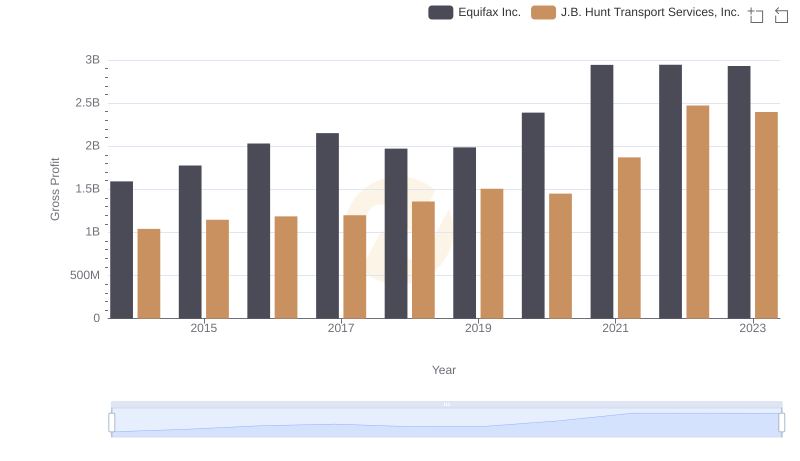
Gross Profit Analysis: Comparing Equifax Inc. and J.B. Hunt Transport Services, Inc.
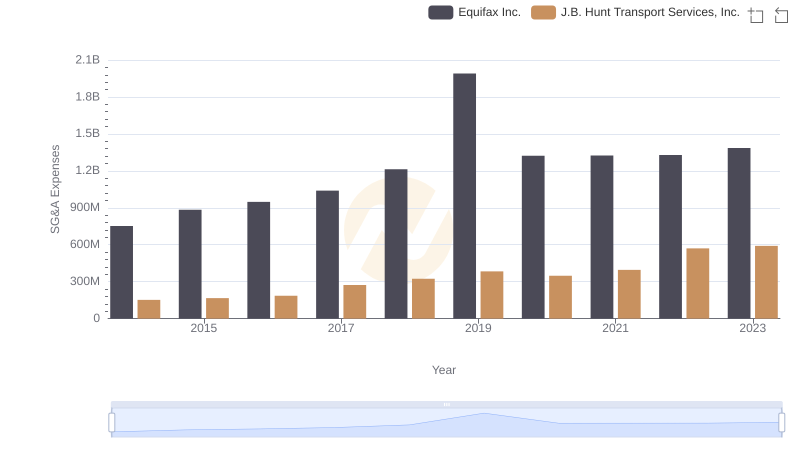
Breaking Down SG&A Expenses: Equifax Inc. vs J.B. Hunt Transport Services, Inc.