| __timestamp | Equifax Inc. | Expeditors International of Washington, Inc. |
|---|---|---|
| Wednesday, January 1, 2014 | 844700000 | 5800725000 |
| Thursday, January 1, 2015 | 887400000 | 5720848000 |
| Friday, January 1, 2016 | 1113400000 | 5247244000 |
| Sunday, January 1, 2017 | 1210700000 | 6037921000 |
| Monday, January 1, 2018 | 1440400000 | 7118083000 |
| Tuesday, January 1, 2019 | 1521700000 | 7178405000 |
| Wednesday, January 1, 2020 | 1737400000 | 8953716000 |
| Friday, January 1, 2021 | 1980900000 | 14358105000 |
| Saturday, January 1, 2022 | 2177200000 | 14900154000 |
| Sunday, January 1, 2023 | 2335100000 | 8054634000 |
| Monday, January 1, 2024 | 0 | 0 |
Unleashing insights
In the ever-evolving landscape of corporate finance, understanding cost structures is crucial. From 2014 to 2023, Equifax Inc. and Expeditors International of Washington, Inc. have shown distinct trajectories in their cost of revenue. Equifax's cost of revenue has surged by approximately 176%, reflecting a strategic expansion and increased operational scale. In contrast, Expeditors International experienced a more volatile journey, peaking in 2022 with a 156% increase from 2014, before a notable decline in 2023. This fluctuation could indicate shifts in global logistics demand or strategic cost management. Such insights are invaluable for investors and analysts seeking to understand the financial health and strategic direction of these industry giants. As we delve deeper into these trends, the data underscores the dynamic nature of cost management in today's competitive business environment.
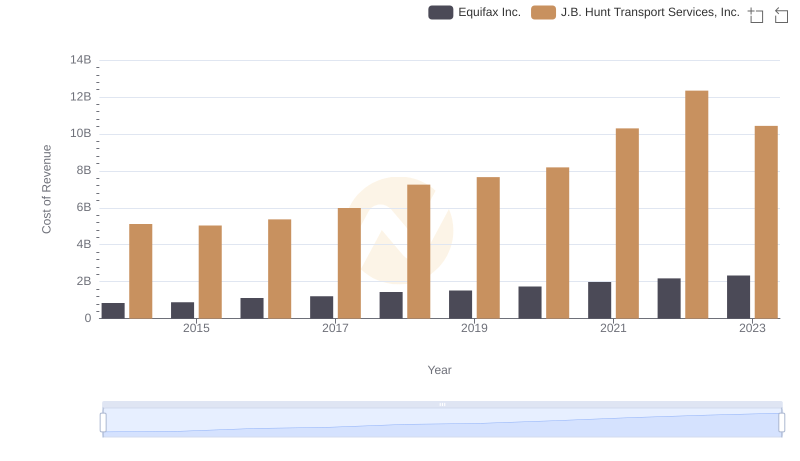
Cost of Revenue Trends: Equifax Inc. vs J.B. Hunt Transport Services, Inc.
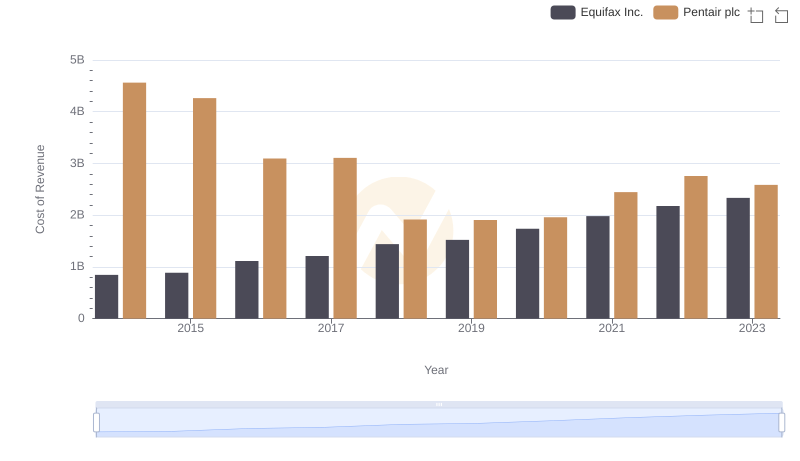
Analyzing Cost of Revenue: Equifax Inc. and Pentair plc
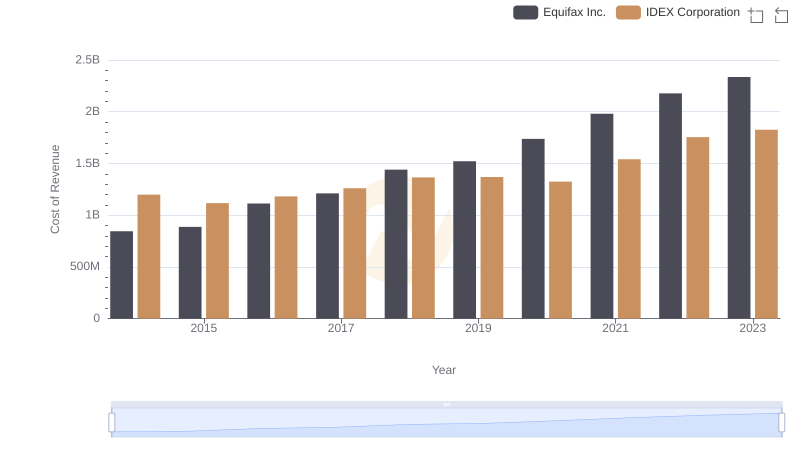
Cost Insights: Breaking Down Equifax Inc. and IDEX Corporation's Expenses
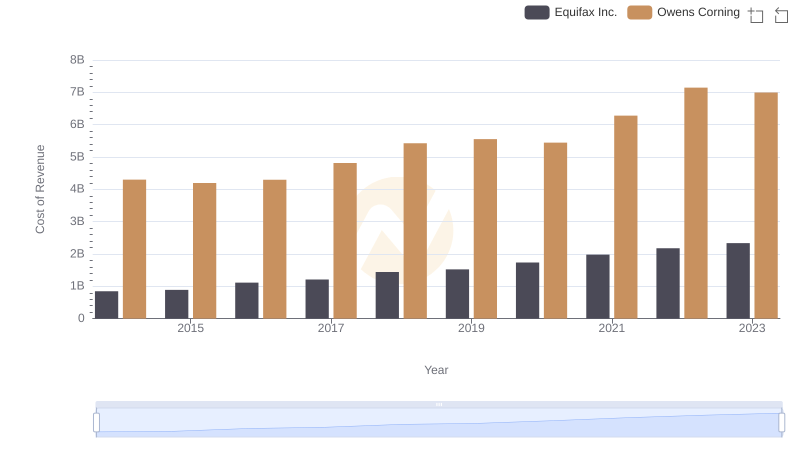
Cost of Revenue Trends: Equifax Inc. vs Owens Corning
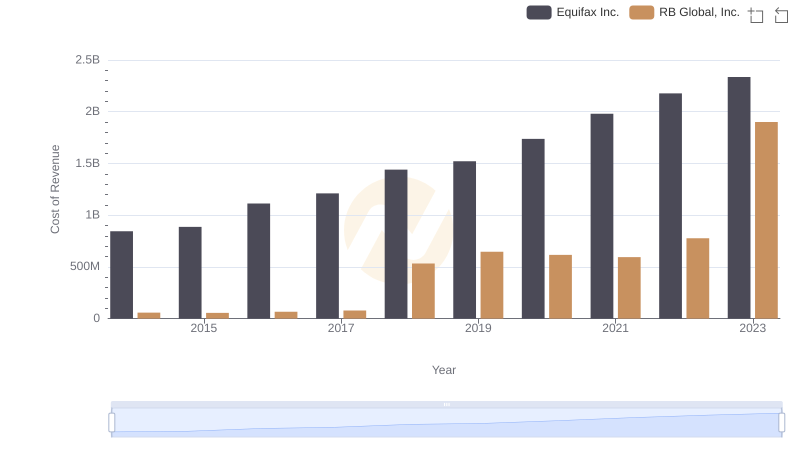
Cost Insights: Breaking Down Equifax Inc. and RB Global, Inc.'s Expenses
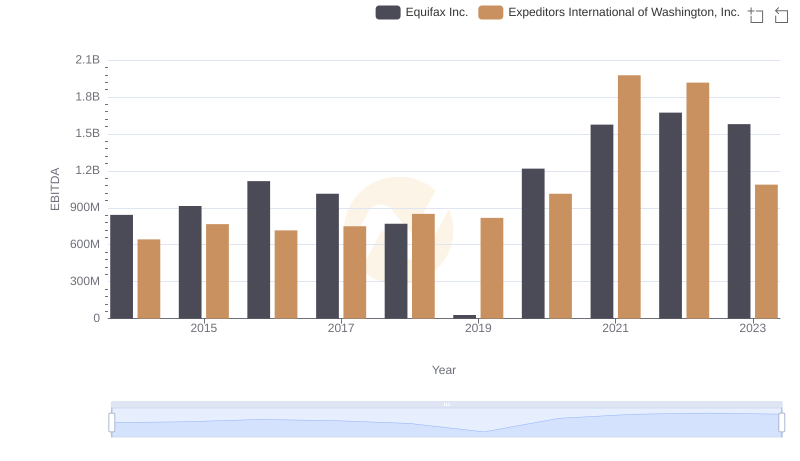
EBITDA Analysis: Evaluating Equifax Inc. Against Expeditors International of Washington, Inc.