| __timestamp | Equifax Inc. | IDEX Corporation |
|---|---|---|
| Wednesday, January 1, 2014 | 844700000 | 1198452000 |
| Thursday, January 1, 2015 | 887400000 | 1116353000 |
| Friday, January 1, 2016 | 1113400000 | 1182276000 |
| Sunday, January 1, 2017 | 1210700000 | 1260634000 |
| Monday, January 1, 2018 | 1440400000 | 1365771000 |
| Tuesday, January 1, 2019 | 1521700000 | 1369539000 |
| Wednesday, January 1, 2020 | 1737400000 | 1324222000 |
| Friday, January 1, 2021 | 1980900000 | 1540300000 |
| Saturday, January 1, 2022 | 2177200000 | 1755000000 |
| Sunday, January 1, 2023 | 2335100000 | 1825400000 |
| Monday, January 1, 2024 | 0 | 1814000000 |
Unleashing the power of data
In the ever-evolving landscape of corporate finance, understanding cost structures is pivotal. This analysis delves into the cost of revenue trends for Equifax Inc. and IDEX Corporation from 2014 to 2023. Over this decade, Equifax's cost of revenue surged by approximately 176%, reflecting a strategic expansion and increased operational scale. In contrast, IDEX Corporation experienced a more modest growth of around 52%, indicating a steady yet controlled cost management approach.
These insights offer a window into the financial strategies of two industry giants, providing valuable lessons in cost management and growth strategies.
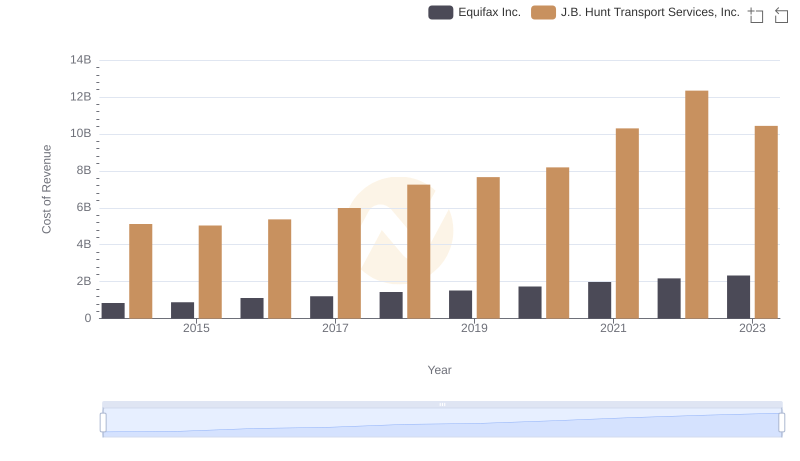
Cost of Revenue Trends: Equifax Inc. vs J.B. Hunt Transport Services, Inc.
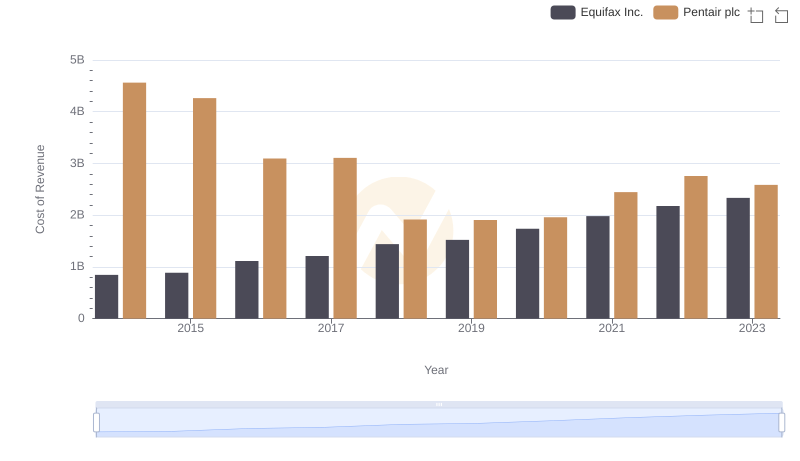
Analyzing Cost of Revenue: Equifax Inc. and Pentair plc
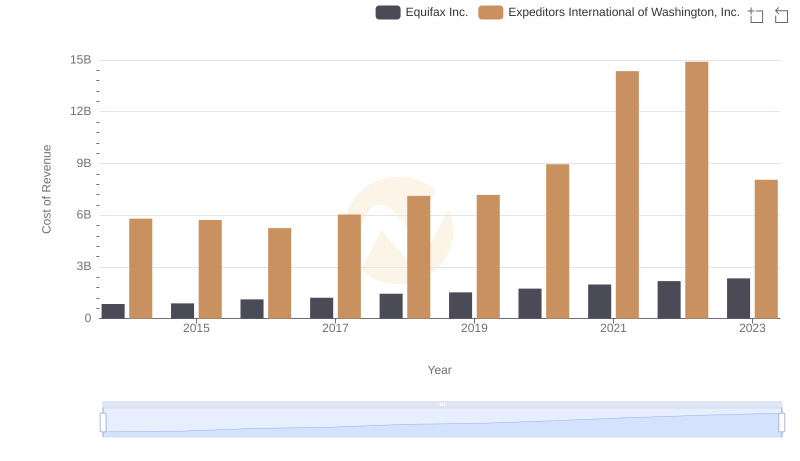
Cost of Revenue: Key Insights for Equifax Inc. and Expeditors International of Washington, Inc.
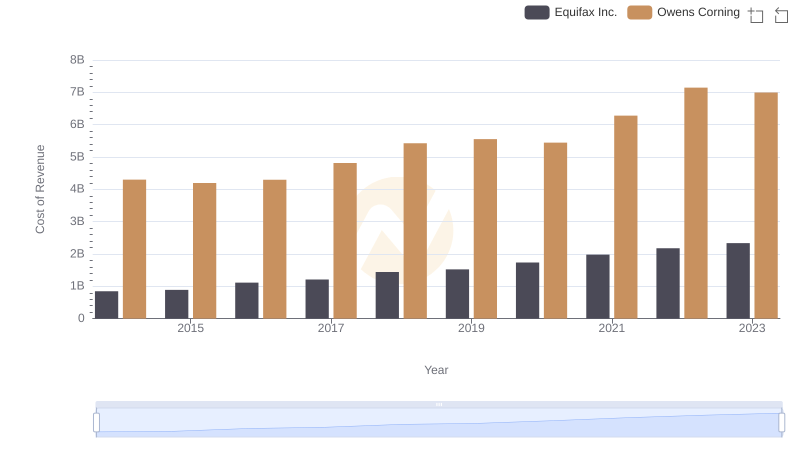
Cost of Revenue Trends: Equifax Inc. vs Owens Corning
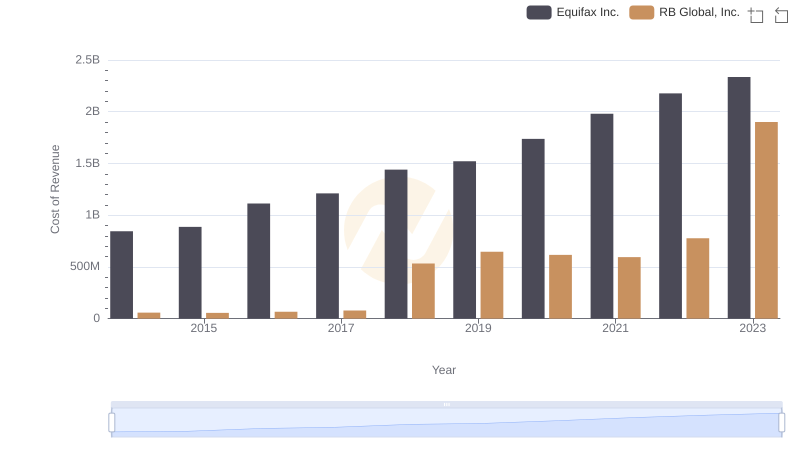
Cost Insights: Breaking Down Equifax Inc. and RB Global, Inc.'s Expenses
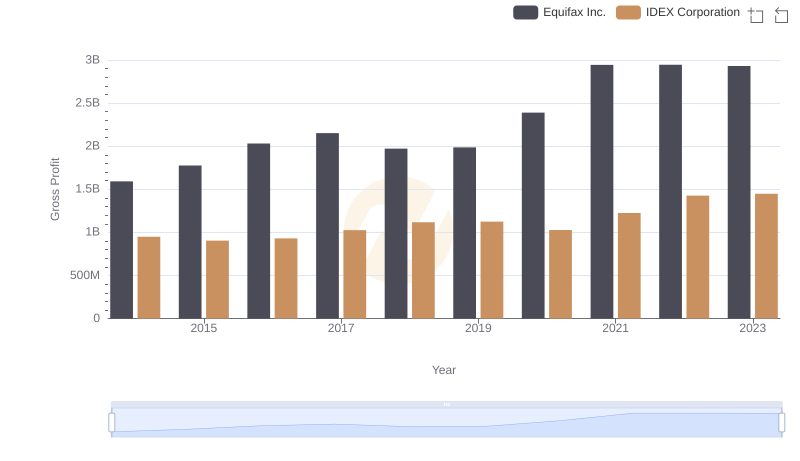
Gross Profit Trends Compared: Equifax Inc. vs IDEX Corporation
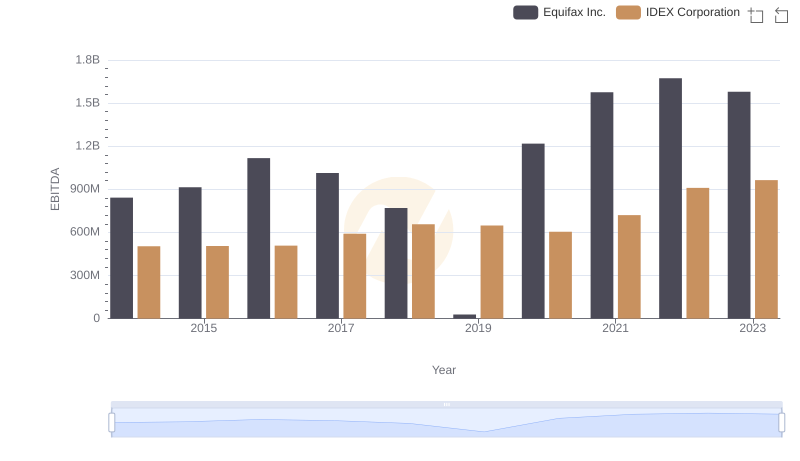
Equifax Inc. and IDEX Corporation: A Detailed Examination of EBITDA Performance