| __timestamp | Eaton Corporation plc | Old Dominion Freight Line, Inc. |
|---|---|---|
| Wednesday, January 1, 2014 | 15646000000 | 2100409000 |
| Thursday, January 1, 2015 | 14292000000 | 2214943000 |
| Friday, January 1, 2016 | 13400000000 | 2246890000 |
| Sunday, January 1, 2017 | 13756000000 | 2482732000 |
| Monday, January 1, 2018 | 14511000000 | 2899452000 |
| Tuesday, January 1, 2019 | 14338000000 | 2938895000 |
| Wednesday, January 1, 2020 | 12408000000 | 2786531000 |
| Friday, January 1, 2021 | 13293000000 | 3481268000 |
| Saturday, January 1, 2022 | 13865000000 | 4003951000 |
| Sunday, January 1, 2023 | 14763000000 | 3793953000 |
| Monday, January 1, 2024 | 15375000000 |
Unleashing the power of data
In the ever-evolving landscape of industrial and freight sectors, understanding cost dynamics is crucial. From 2014 to 2023, Eaton Corporation plc and Old Dominion Freight Line, Inc. have showcased distinct cost of revenue trends. Eaton's cost of revenue, peaking at approximately $15.6 billion in 2014, saw a dip to around $12.4 billion in 2020, before rebounding to $14.8 billion by 2023. This reflects a 5% decrease over the decade, highlighting strategic cost management.
Conversely, Old Dominion Freight Line, Inc. experienced a robust growth trajectory, with costs rising from $2.1 billion in 2014 to nearly $4 billion in 2022, marking an impressive 90% increase. This surge underscores the company's expansion and increased operational scale. These trends offer valuable insights into the financial strategies and market positioning of these industry giants.

Eaton Corporation plc vs Old Dominion Freight Line, Inc.: Annual Revenue Growth Compared
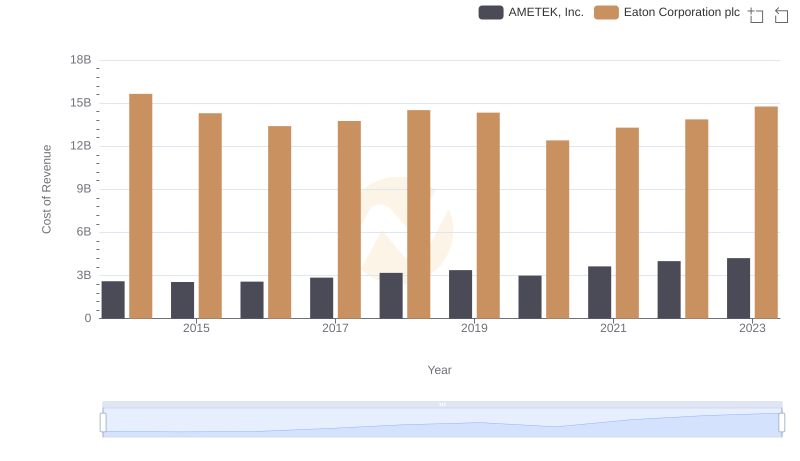
Comparing Cost of Revenue Efficiency: Eaton Corporation plc vs AMETEK, Inc.
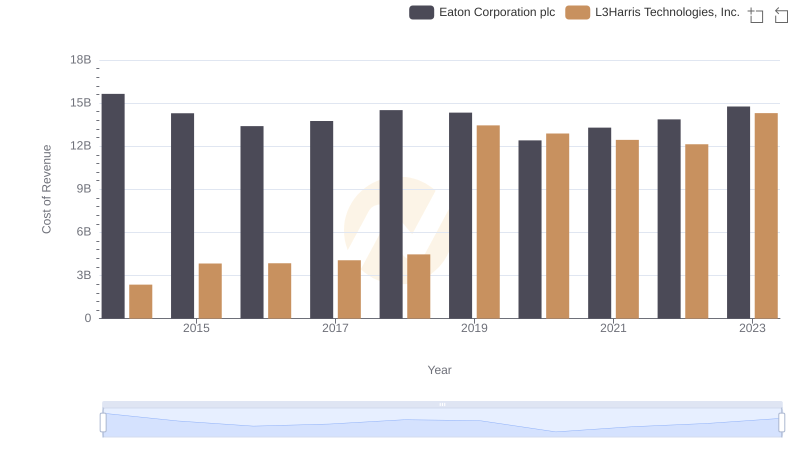
Analyzing Cost of Revenue: Eaton Corporation plc and L3Harris Technologies, Inc.
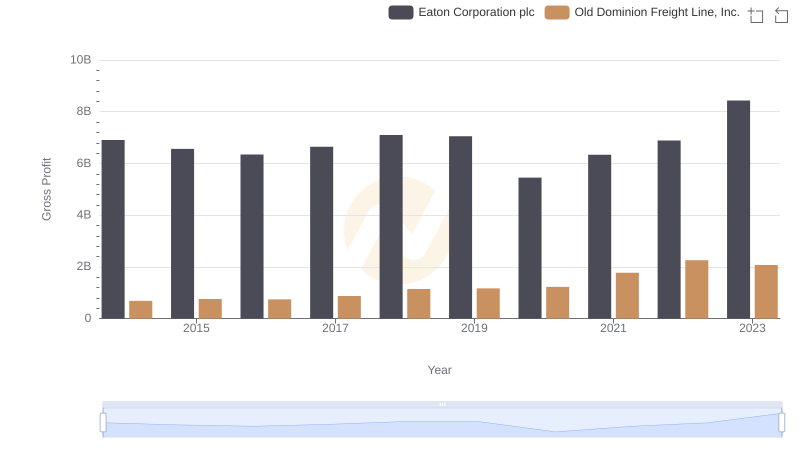
Gross Profit Analysis: Comparing Eaton Corporation plc and Old Dominion Freight Line, Inc.
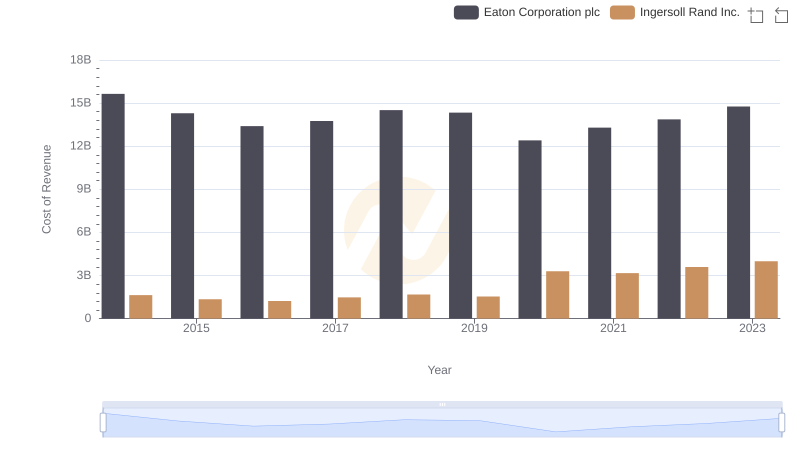
Cost of Revenue Trends: Eaton Corporation plc vs Ingersoll Rand Inc.
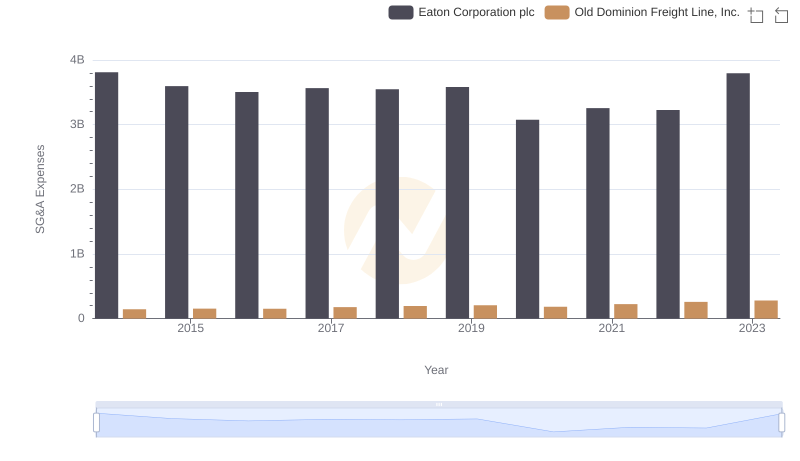
Eaton Corporation plc or Old Dominion Freight Line, Inc.: Who Manages SG&A Costs Better?