| __timestamp | Eaton Corporation plc | L3Harris Technologies, Inc. |
|---|---|---|
| Wednesday, January 1, 2014 | 15646000000 | 2370000000 |
| Thursday, January 1, 2015 | 14292000000 | 3832000000 |
| Friday, January 1, 2016 | 13400000000 | 3854000000 |
| Sunday, January 1, 2017 | 13756000000 | 4066000000 |
| Monday, January 1, 2018 | 14511000000 | 4467000000 |
| Tuesday, January 1, 2019 | 14338000000 | 13452000000 |
| Wednesday, January 1, 2020 | 12408000000 | 12886000000 |
| Friday, January 1, 2021 | 13293000000 | 12438000000 |
| Saturday, January 1, 2022 | 13865000000 | 12135000000 |
| Sunday, January 1, 2023 | 14763000000 | 14306000000 |
| Monday, January 1, 2024 | 15375000000 | 15801000000 |
Infusing magic into the data realm
In the ever-evolving landscape of industrial and defense sectors, Eaton Corporation plc and L3Harris Technologies, Inc. stand as titans. Over the past decade, these companies have showcased intriguing trends in their cost of revenue. Eaton Corporation, a leader in power management, has seen a relatively stable cost of revenue, averaging around $14 billion annually. However, a notable dip occurred in 2020, coinciding with global economic disruptions.
Conversely, L3Harris Technologies, a key player in defense technology, experienced a dramatic rise in cost of revenue, peaking in 2023 with a 500% increase from 2014. This surge reflects strategic expansions and increased demand for defense solutions.
These trends highlight the dynamic nature of these industries, where external factors and strategic decisions significantly impact financial outcomes. As we move forward, monitoring these shifts will be crucial for stakeholders and investors alike.
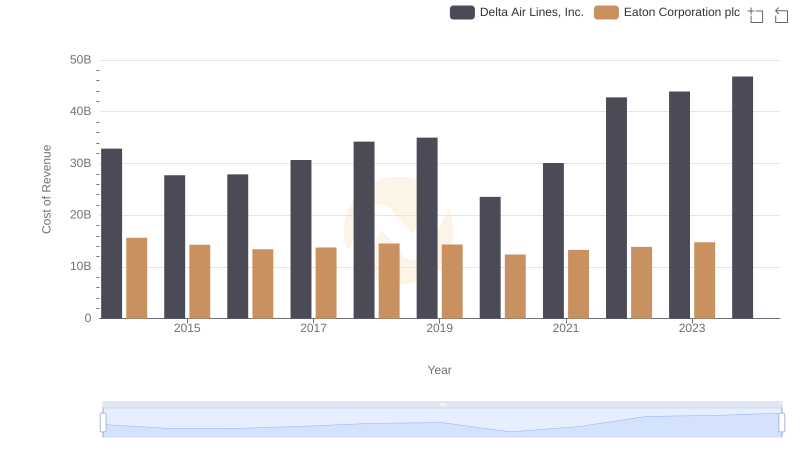
Comparing Cost of Revenue Efficiency: Eaton Corporation plc vs Delta Air Lines, Inc.
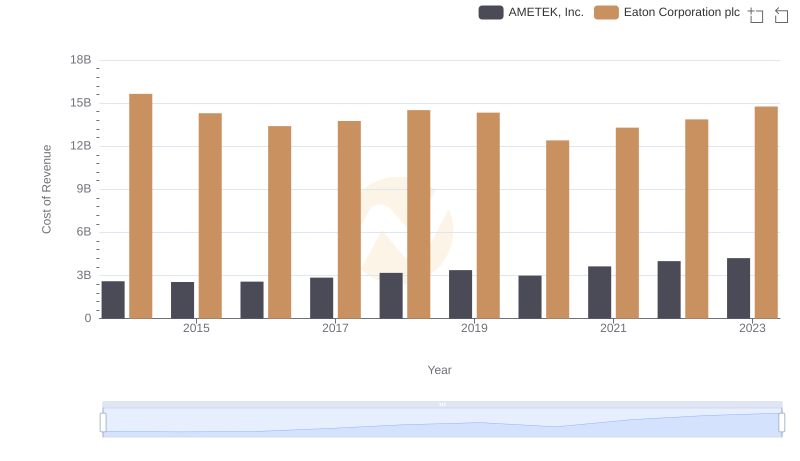
Comparing Cost of Revenue Efficiency: Eaton Corporation plc vs AMETEK, Inc.
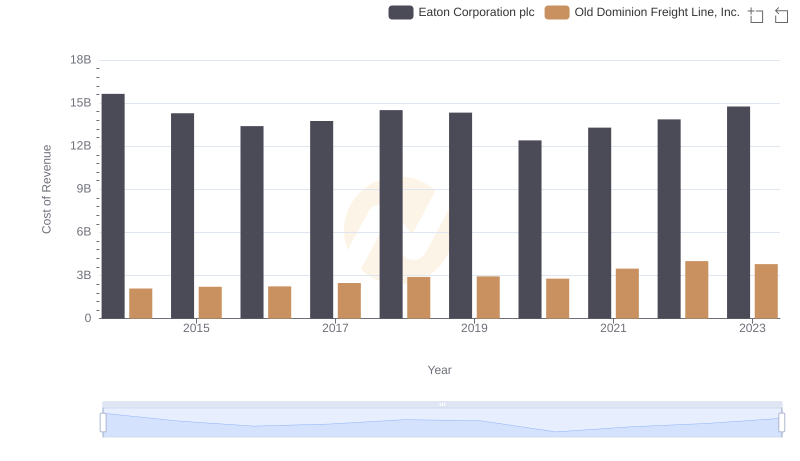
Cost of Revenue Trends: Eaton Corporation plc vs Old Dominion Freight Line, Inc.
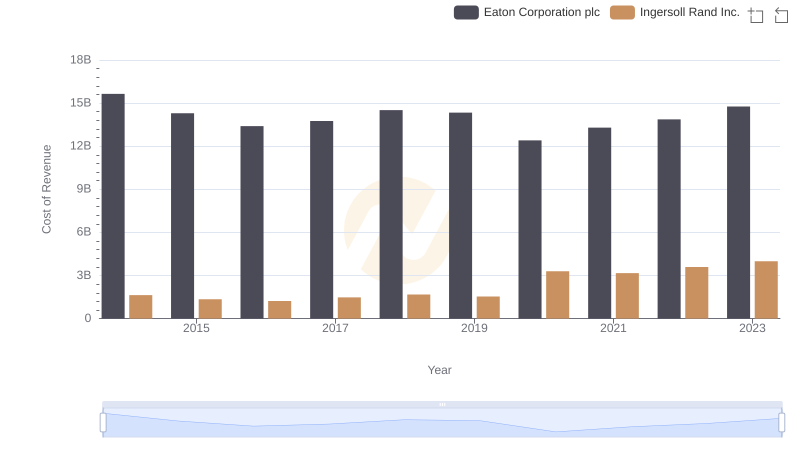
Cost of Revenue Trends: Eaton Corporation plc vs Ingersoll Rand Inc.
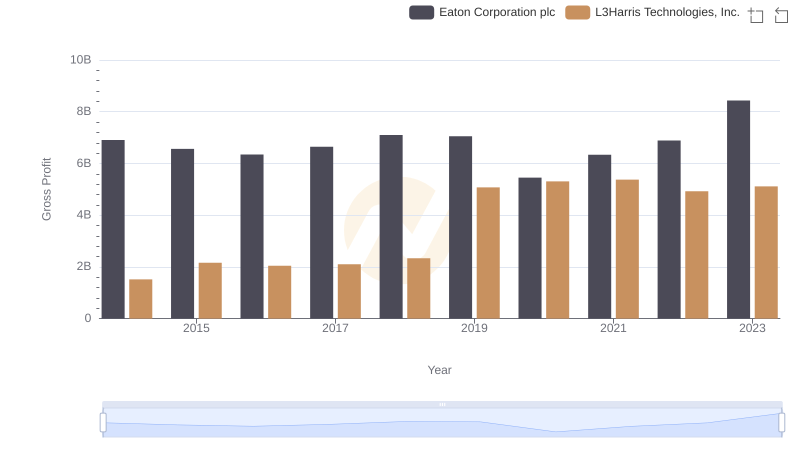
Gross Profit Comparison: Eaton Corporation plc and L3Harris Technologies, Inc. Trends
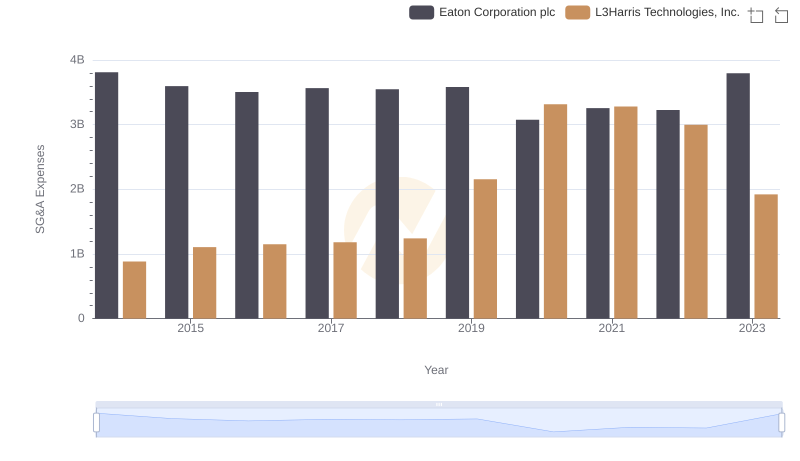
Who Optimizes SG&A Costs Better? Eaton Corporation plc or L3Harris Technologies, Inc.