| __timestamp | Eaton Corporation plc | Old Dominion Freight Line, Inc. |
|---|---|---|
| Wednesday, January 1, 2014 | 22552000000 | 2787897000 |
| Thursday, January 1, 2015 | 20855000000 | 2972442000 |
| Friday, January 1, 2016 | 19747000000 | 2991517000 |
| Sunday, January 1, 2017 | 20404000000 | 3358112000 |
| Monday, January 1, 2018 | 21609000000 | 4043695000 |
| Tuesday, January 1, 2019 | 21390000000 | 4109111000 |
| Wednesday, January 1, 2020 | 17858000000 | 4015129000 |
| Friday, January 1, 2021 | 19628000000 | 5256328000 |
| Saturday, January 1, 2022 | 20752000000 | 6260077000 |
| Sunday, January 1, 2023 | 23196000000 | 5866152000 |
| Monday, January 1, 2024 | 24878000000 |
In pursuit of knowledge
In the ever-evolving landscape of industrial and freight sectors, Eaton Corporation plc and Old Dominion Freight Line, Inc. have showcased intriguing revenue trajectories over the past decade. From 2014 to 2023, Eaton's revenue fluctuated, peaking in 2023 with a 15% increase from its 2014 figures. Meanwhile, Old Dominion demonstrated a robust growth pattern, with its revenue more than doubling, reaching a zenith in 2022.
Eaton, a leader in power management, faced challenges in 2020, with revenues dipping by 17% compared to 2019, likely due to global disruptions. Conversely, Old Dominion, a freight powerhouse, capitalized on the e-commerce boom, achieving a remarkable 50% revenue surge from 2017 to 2021.
These trends underscore the dynamic nature of these industries, where adaptability and strategic foresight are key to sustained growth.
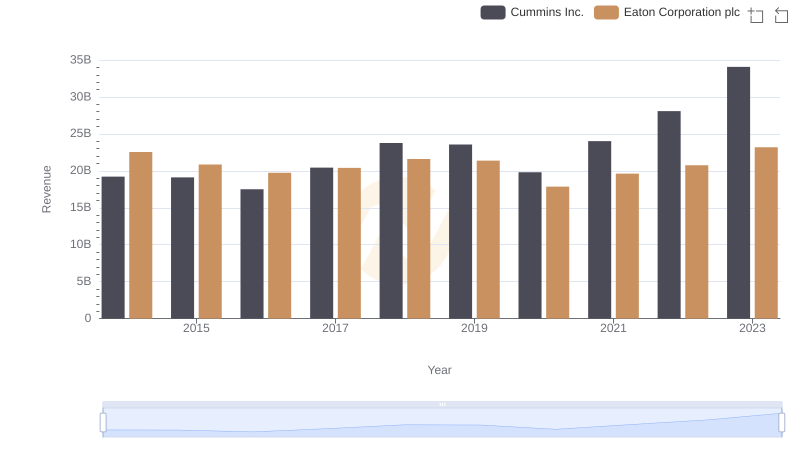
Comparing Revenue Performance: Eaton Corporation plc or Cummins Inc.?
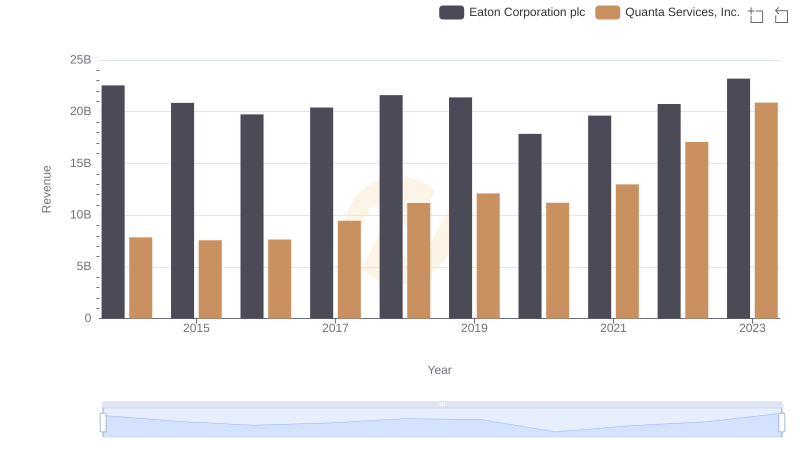
Eaton Corporation plc vs Quanta Services, Inc.: Examining Key Revenue Metrics

Breaking Down Revenue Trends: Eaton Corporation plc vs Ingersoll Rand Inc.
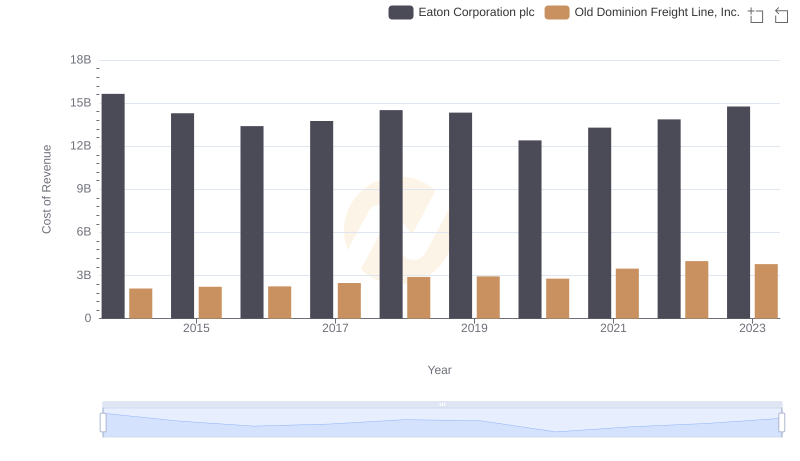
Cost of Revenue Trends: Eaton Corporation plc vs Old Dominion Freight Line, Inc.
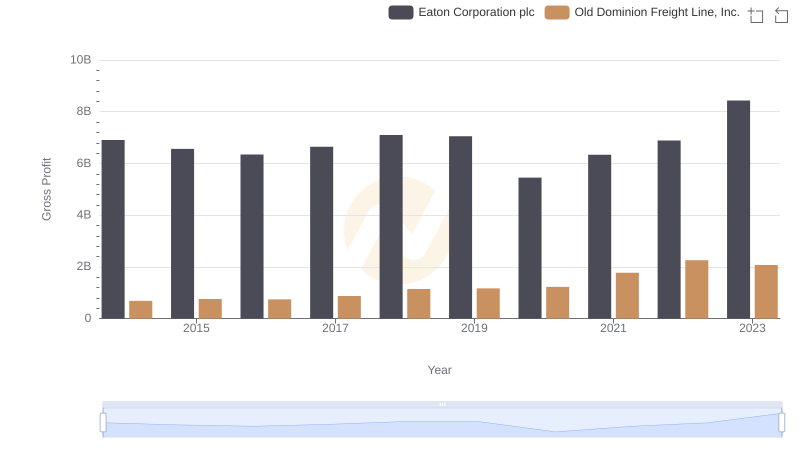
Gross Profit Analysis: Comparing Eaton Corporation plc and Old Dominion Freight Line, Inc.
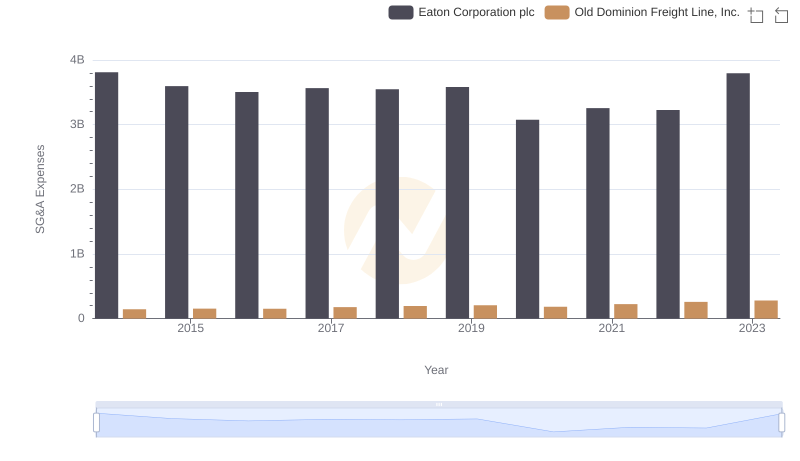
Eaton Corporation plc or Old Dominion Freight Line, Inc.: Who Manages SG&A Costs Better?