| __timestamp | AMETEK, Inc. | Eaton Corporation plc |
|---|---|---|
| Wednesday, January 1, 2014 | 2597017000 | 15646000000 |
| Thursday, January 1, 2015 | 2549280000 | 14292000000 |
| Friday, January 1, 2016 | 2575220000 | 13400000000 |
| Sunday, January 1, 2017 | 2851431000 | 13756000000 |
| Monday, January 1, 2018 | 3186310000 | 14511000000 |
| Tuesday, January 1, 2019 | 3370897000 | 14338000000 |
| Wednesday, January 1, 2020 | 2996515000 | 12408000000 |
| Friday, January 1, 2021 | 3633900000 | 13293000000 |
| Saturday, January 1, 2022 | 4005261000 | 13865000000 |
| Sunday, January 1, 2023 | 4212484999 | 14763000000 |
| Monday, January 1, 2024 | 0 | 15375000000 |
Unveiling the hidden dimensions of data
In the competitive landscape of industrial manufacturing, cost efficiency is a critical metric. Over the past decade, Eaton Corporation plc and AMETEK, Inc. have demonstrated contrasting trends in their cost of revenue. Eaton, with a robust average cost of revenue of approximately $14 billion annually, has shown a steady yet fluctuating pattern, peaking in 2014 and 2023. In contrast, AMETEK has consistently increased its cost efficiency, with a notable 62% rise from 2014 to 2023, reaching over $4 billion. This trend highlights AMETEK's strategic focus on optimizing operational costs, even as Eaton maintains a larger scale of operations. The data underscores the importance of strategic cost management in sustaining competitive advantage in the industrial sector. As we look to the future, these trends may offer insights into the evolving strategies of these industry giants.
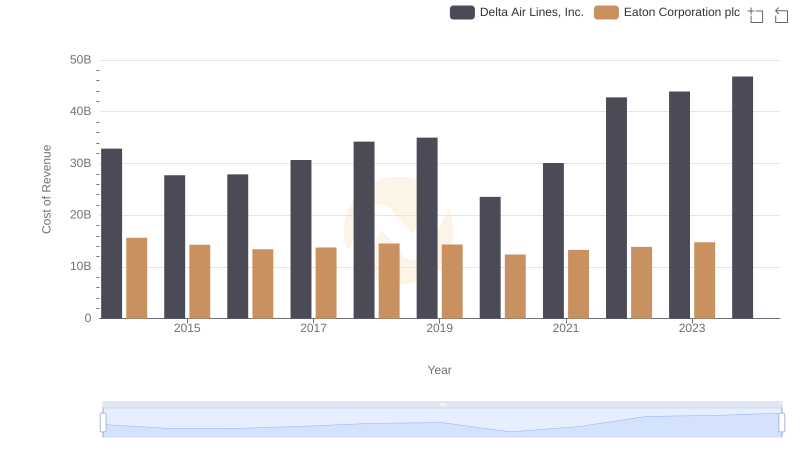
Comparing Cost of Revenue Efficiency: Eaton Corporation plc vs Delta Air Lines, Inc.
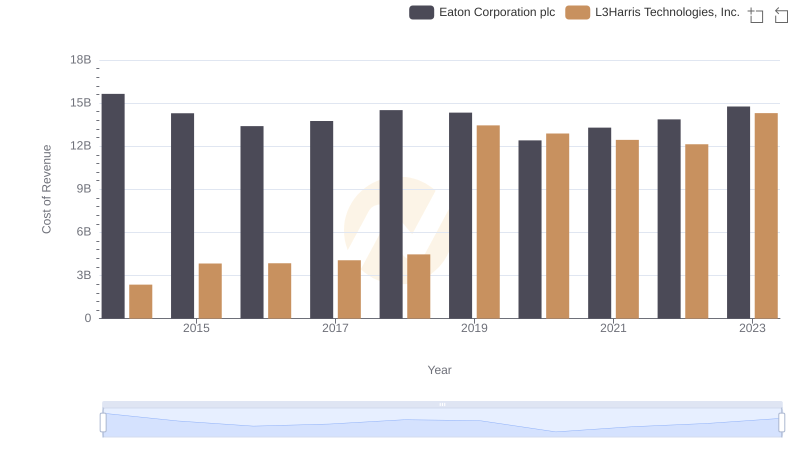
Analyzing Cost of Revenue: Eaton Corporation plc and L3Harris Technologies, Inc.
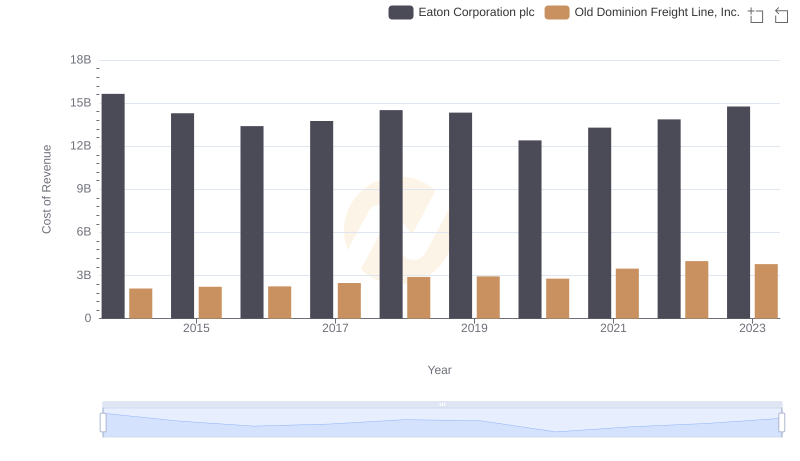
Cost of Revenue Trends: Eaton Corporation plc vs Old Dominion Freight Line, Inc.
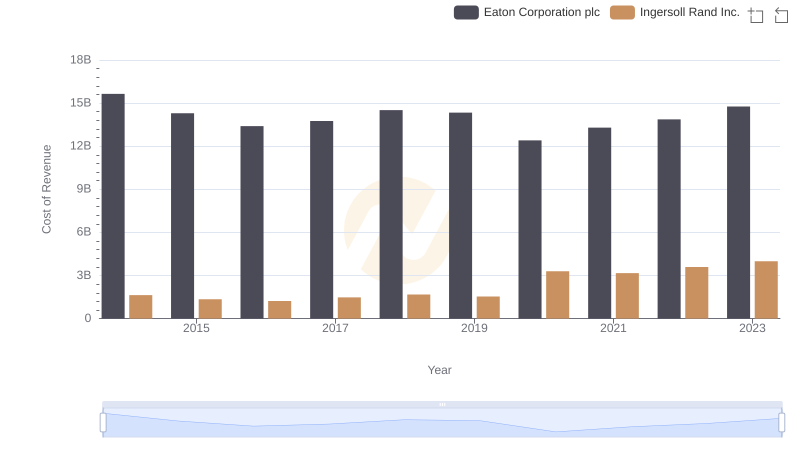
Cost of Revenue Trends: Eaton Corporation plc vs Ingersoll Rand Inc.

Cost Management Insights: SG&A Expenses for Eaton Corporation plc and AMETEK, Inc.
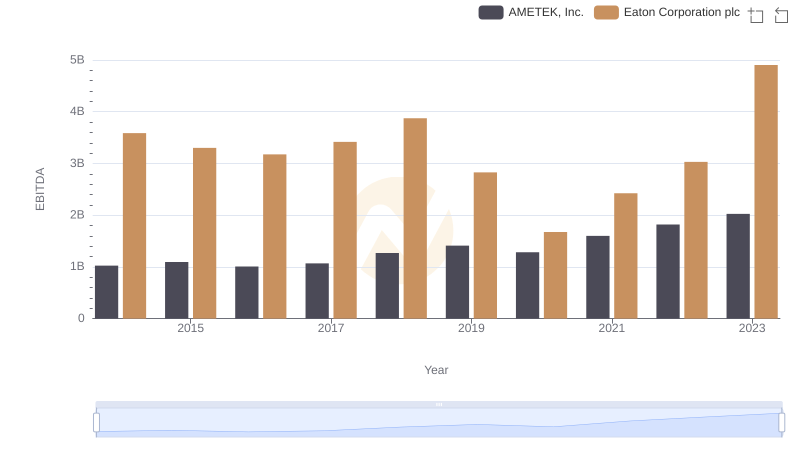
A Professional Review of EBITDA: Eaton Corporation plc Compared to AMETEK, Inc.