| __timestamp | Cisco Systems, Inc. | Corning Incorporated |
|---|---|---|
| Wednesday, January 1, 2014 | 19373000000 | 5663000000 |
| Thursday, January 1, 2015 | 19480000000 | 5458000000 |
| Friday, January 1, 2016 | 18287000000 | 5644000000 |
| Sunday, January 1, 2017 | 17781000000 | 6084000000 |
| Monday, January 1, 2018 | 18724000000 | 6829000000 |
| Tuesday, January 1, 2019 | 19238000000 | 7468000000 |
| Wednesday, January 1, 2020 | 17618000000 | 7772000000 |
| Friday, January 1, 2021 | 17924000000 | 9019000000 |
| Saturday, January 1, 2022 | 19309000000 | 9683000000 |
| Sunday, January 1, 2023 | 21245000000 | 8657000000 |
| Monday, January 1, 2024 | 18975000000 | 8842000000 |
Unleashing the power of data
In the ever-evolving landscape of technology and manufacturing, Cisco Systems, Inc. and Corning Incorporated stand as titans. Over the past decade, from 2014 to 2023, these companies have showcased distinct trends in their cost of revenue. Cisco, a leader in networking hardware, has seen a relatively stable cost of revenue, peaking in 2023 with a 10% increase from its 2014 figures. Meanwhile, Corning, renowned for its glass and ceramics, experienced a more dynamic trajectory, with a notable 71% rise from 2014 to 2022, before a slight dip in 2023. This divergence highlights the contrasting challenges and opportunities faced by tech and manufacturing sectors. As we look to the future, understanding these trends offers valuable insights into the strategic maneuvers of these industry leaders.
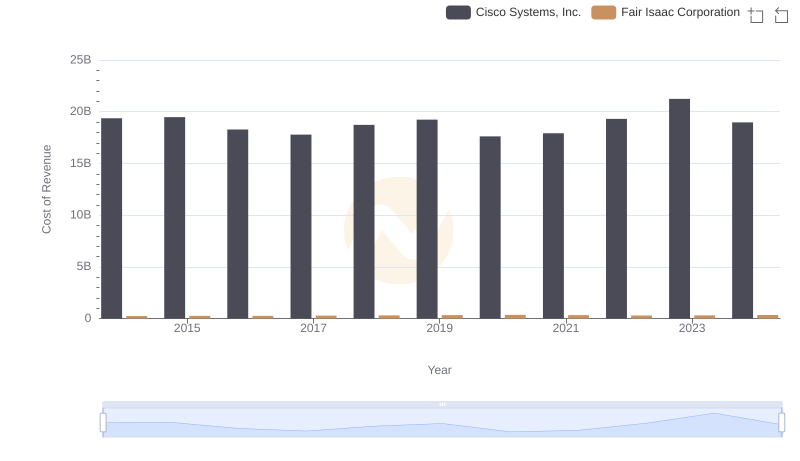
Cost Insights: Breaking Down Cisco Systems, Inc. and Fair Isaac Corporation's Expenses
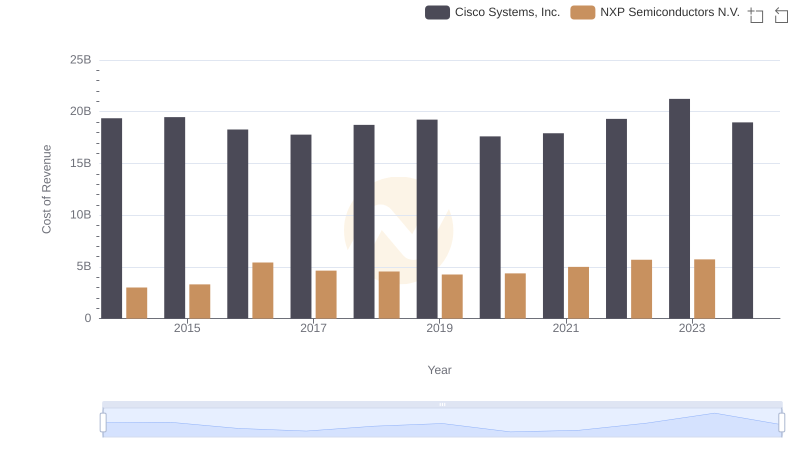
Analyzing Cost of Revenue: Cisco Systems, Inc. and NXP Semiconductors N.V.
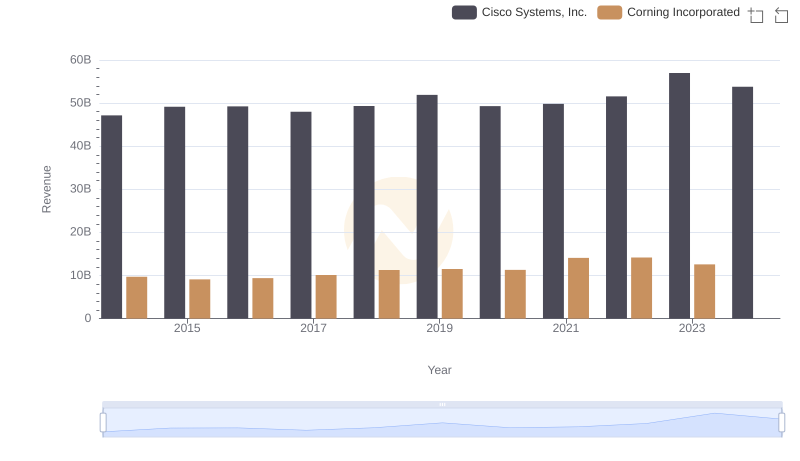
Annual Revenue Comparison: Cisco Systems, Inc. vs Corning Incorporated
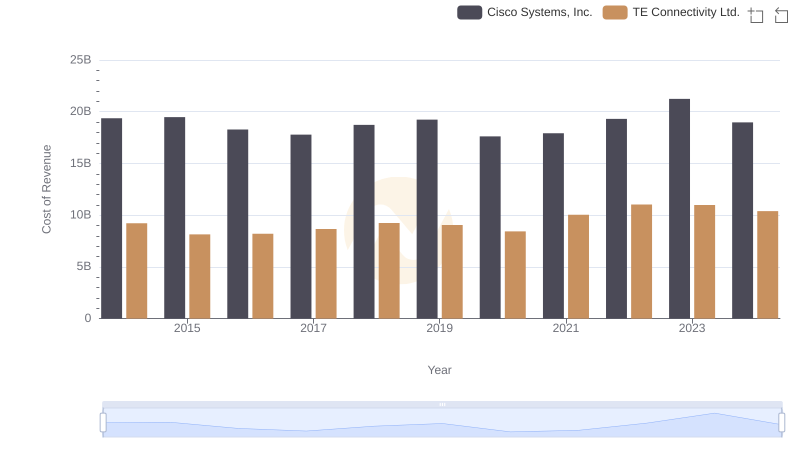
Cost of Revenue Trends: Cisco Systems, Inc. vs TE Connectivity Ltd.

Cost of Revenue Comparison: Cisco Systems, Inc. vs Fidelity National Information Services, Inc.
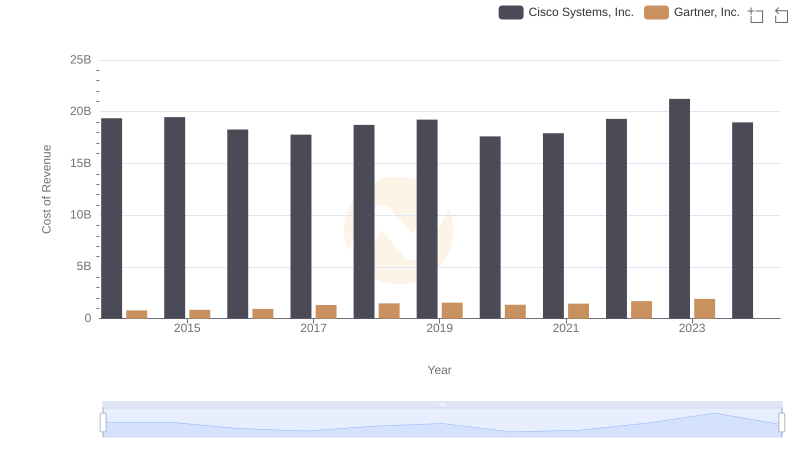
Cost of Revenue: Key Insights for Cisco Systems, Inc. and Gartner, Inc.
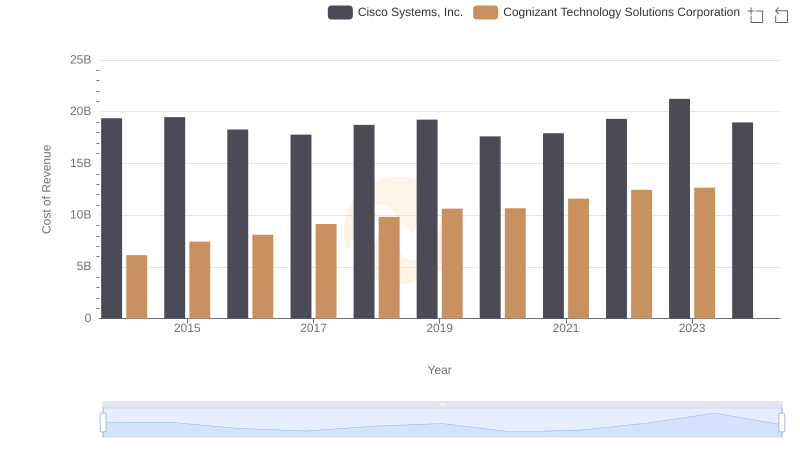
Analyzing Cost of Revenue: Cisco Systems, Inc. and Cognizant Technology Solutions Corporation
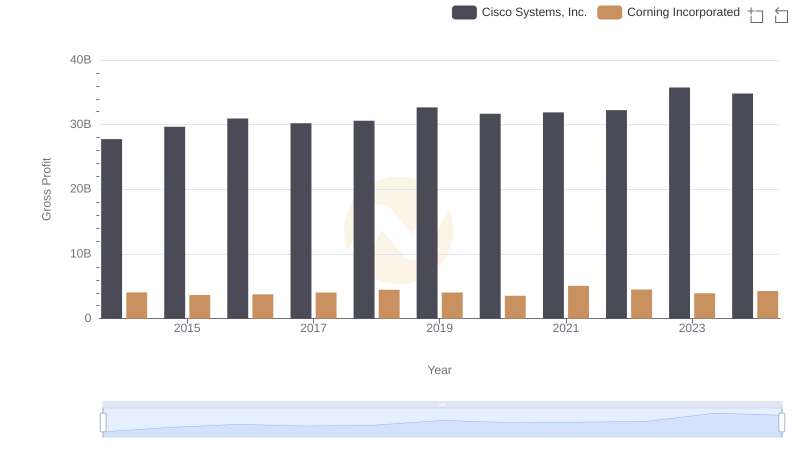
Who Generates Higher Gross Profit? Cisco Systems, Inc. or Corning Incorporated
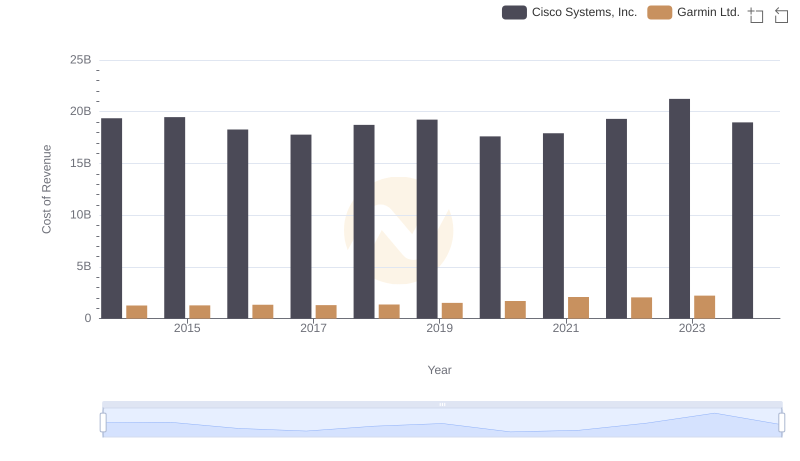
Cost of Revenue Trends: Cisco Systems, Inc. vs Garmin Ltd.
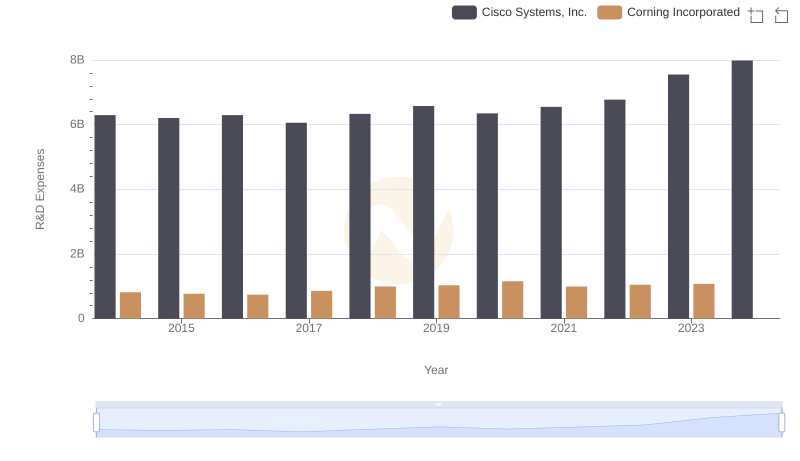
Research and Development Expenses Breakdown: Cisco Systems, Inc. vs Corning Incorporated
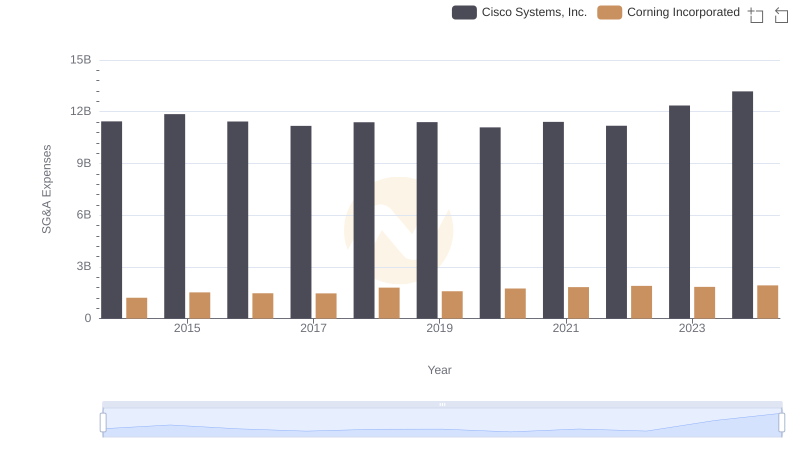
Cisco Systems, Inc. or Corning Incorporated: Who Manages SG&A Costs Better?
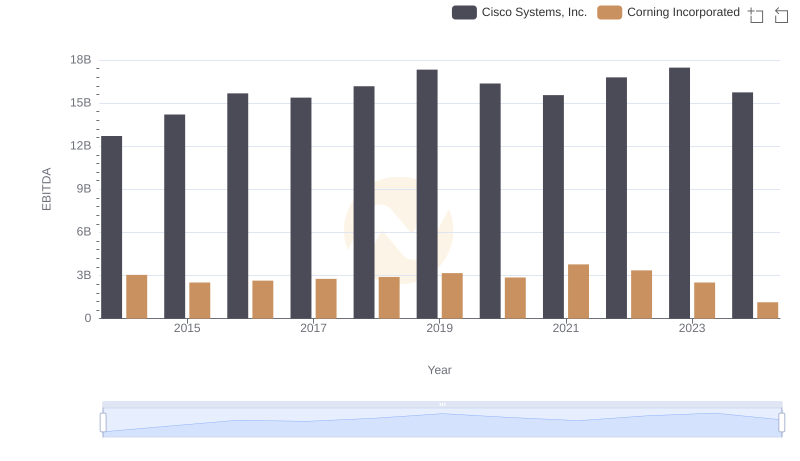
Cisco Systems, Inc. vs Corning Incorporated: In-Depth EBITDA Performance Comparison