| __timestamp | Cisco Systems, Inc. | Corning Incorporated |
|---|---|---|
| Wednesday, January 1, 2014 | 47142000000 | 9715000000 |
| Thursday, January 1, 2015 | 49161000000 | 9111000000 |
| Friday, January 1, 2016 | 49247000000 | 9390000000 |
| Sunday, January 1, 2017 | 48005000000 | 10116000000 |
| Monday, January 1, 2018 | 49330000000 | 11290000000 |
| Tuesday, January 1, 2019 | 51904000000 | 11503000000 |
| Wednesday, January 1, 2020 | 49301000000 | 11303000000 |
| Friday, January 1, 2021 | 49818000000 | 14082000000 |
| Saturday, January 1, 2022 | 51557000000 | 14189000000 |
| Sunday, January 1, 2023 | 56998000000 | 12588000000 |
| Monday, January 1, 2024 | 53803000000 | 13118000000 |
Cracking the code
In the ever-evolving tech landscape, Cisco Systems, Inc. and Corning Incorporated have been pivotal players. Over the past decade, Cisco has consistently outperformed Corning in terms of annual revenue. From 2014 to 2023, Cisco's revenue surged by approximately 21%, peaking in 2023 with a remarkable $57 billion. In contrast, Corning's revenue grew by about 30% during the same period, reaching its zenith in 2022 with $14 billion. However, 2023 saw a slight dip for Corning, highlighting the volatility in the tech industry. This comparison underscores Cisco's dominance in the networking sector, while Corning's growth reflects its innovation in materials science. The data also reveals missing values for Corning in 2024, indicating potential reporting delays or strategic shifts. As we look to the future, these trends offer valuable insights into the strategic directions of these industry giants.
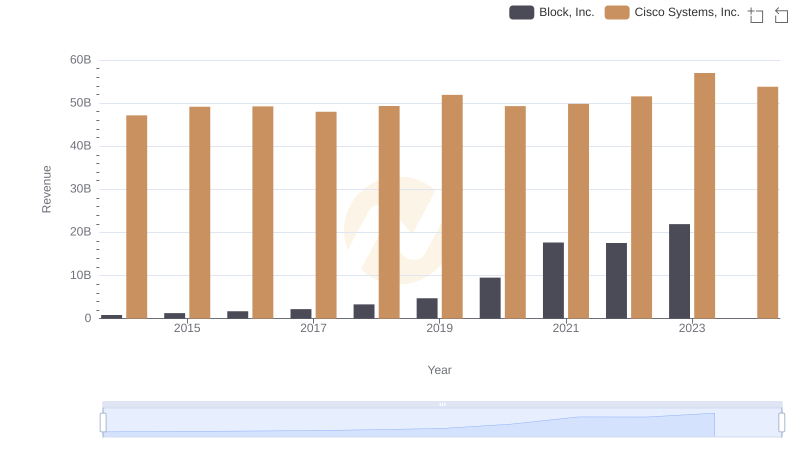
Revenue Insights: Cisco Systems, Inc. and Block, Inc. Performance Compared
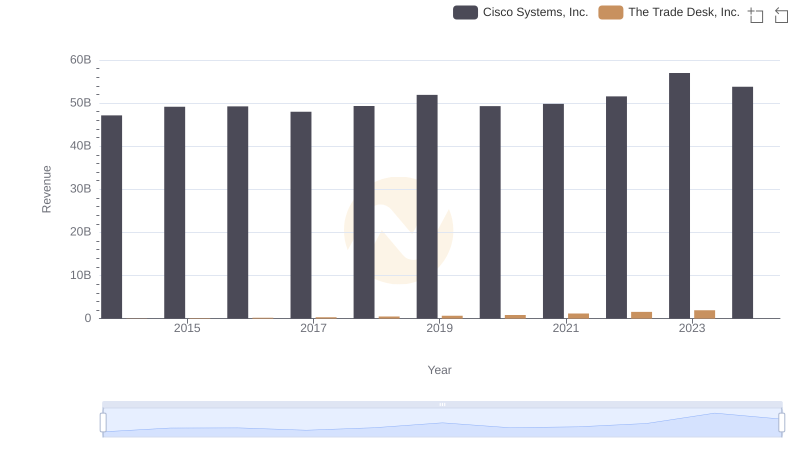
Cisco Systems, Inc. or The Trade Desk, Inc.: Who Leads in Yearly Revenue?
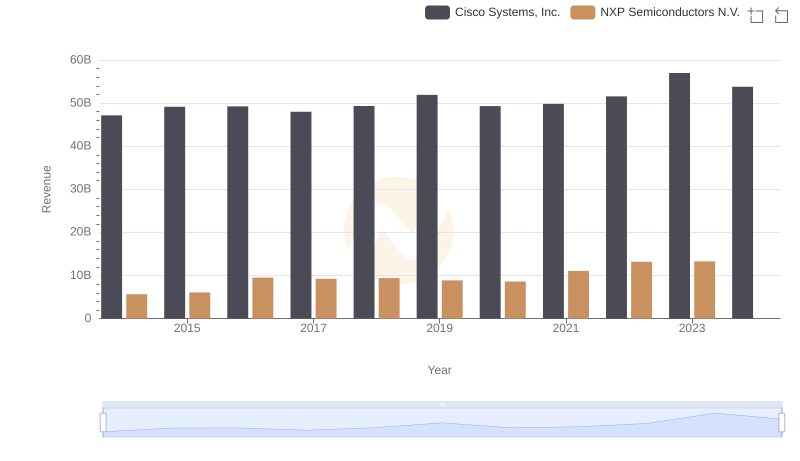
Cisco Systems, Inc. and NXP Semiconductors N.V.: A Comprehensive Revenue Analysis
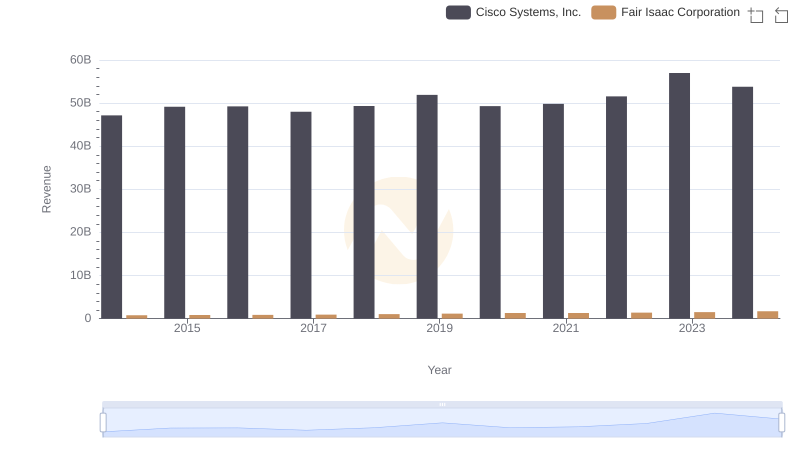
Annual Revenue Comparison: Cisco Systems, Inc. vs Fair Isaac Corporation

Breaking Down Revenue Trends: Cisco Systems, Inc. vs TE Connectivity Ltd.
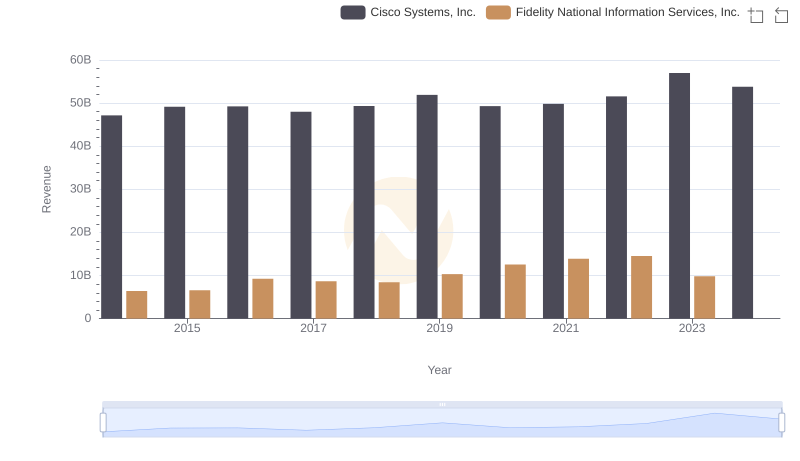
Cisco Systems, Inc. or Fidelity National Information Services, Inc.: Who Leads in Yearly Revenue?
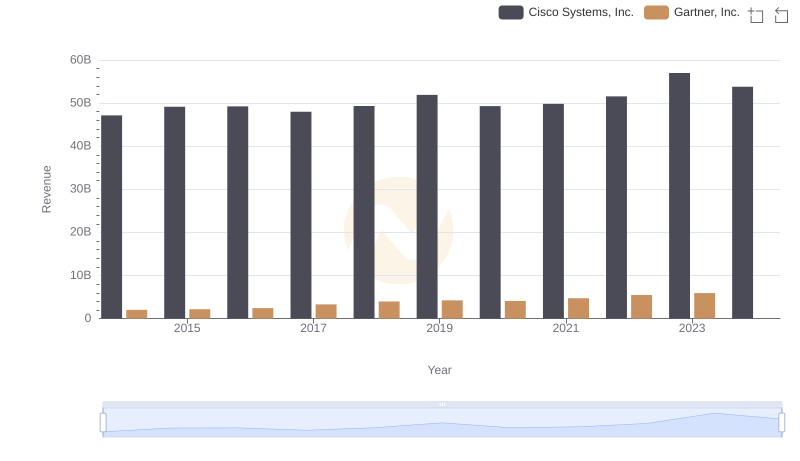
Comparing Revenue Performance: Cisco Systems, Inc. or Gartner, Inc.?
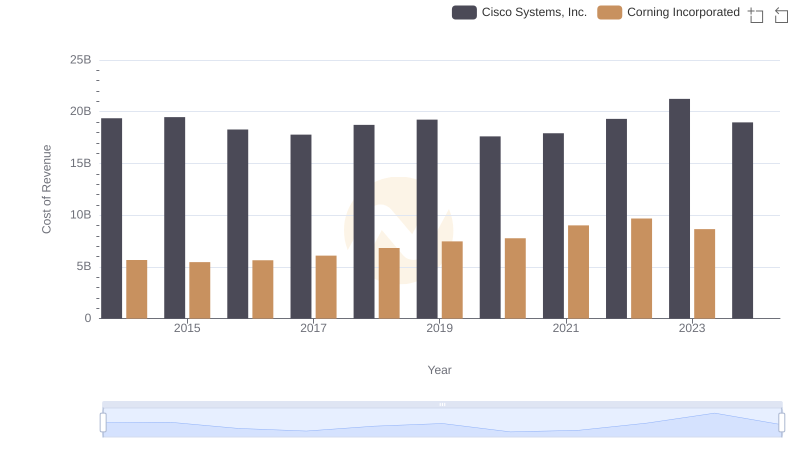
Cost of Revenue Trends: Cisco Systems, Inc. vs Corning Incorporated
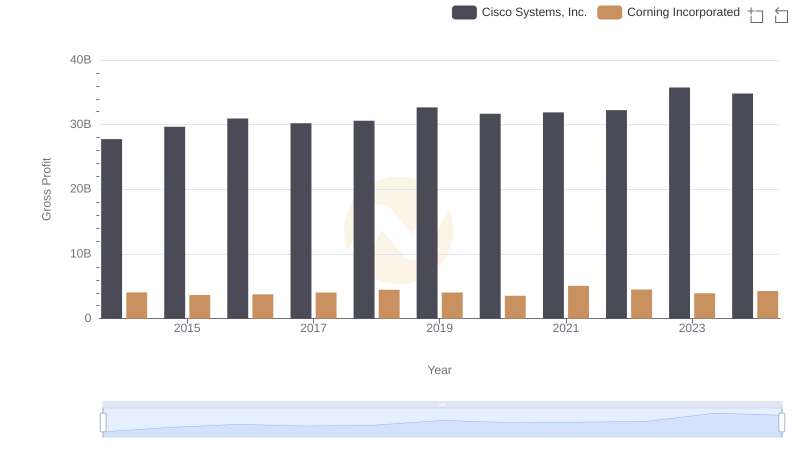
Who Generates Higher Gross Profit? Cisco Systems, Inc. or Corning Incorporated
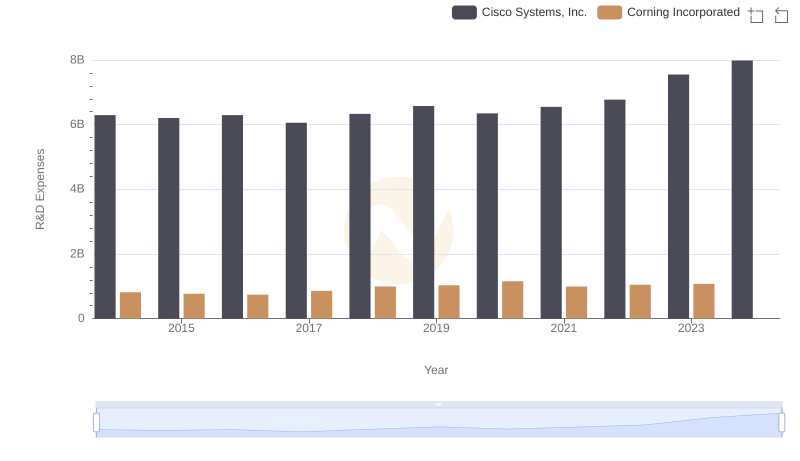
Research and Development Expenses Breakdown: Cisco Systems, Inc. vs Corning Incorporated
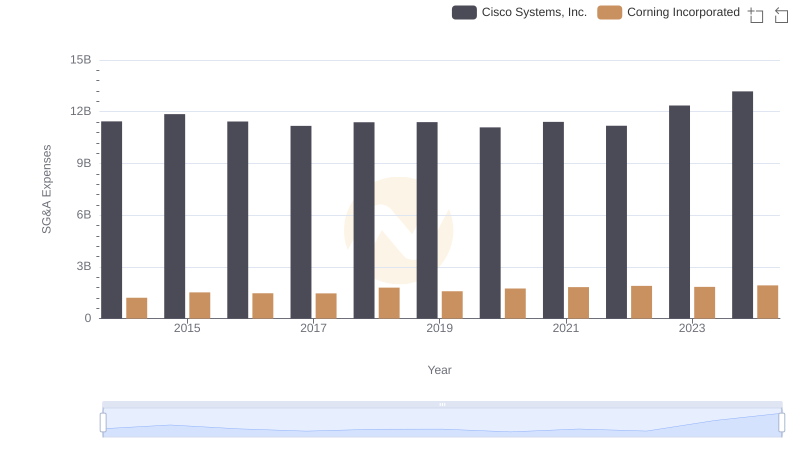
Cisco Systems, Inc. or Corning Incorporated: Who Manages SG&A Costs Better?
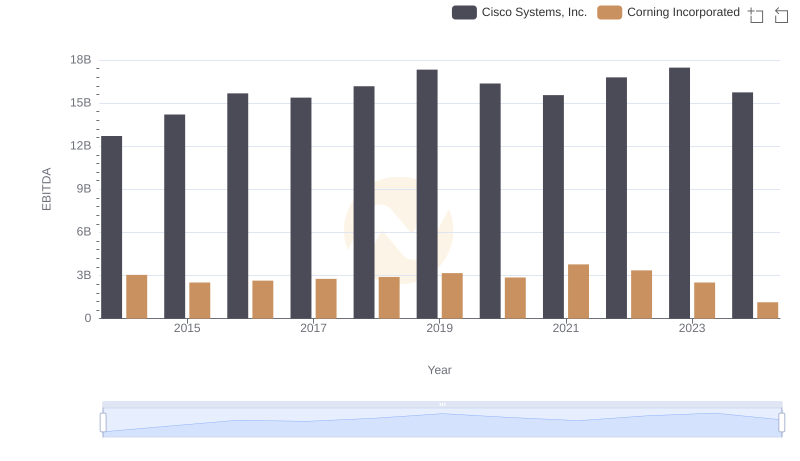
Cisco Systems, Inc. vs Corning Incorporated: In-Depth EBITDA Performance Comparison