| __timestamp | Automatic Data Processing, Inc. | Fastenal Company |
|---|---|---|
| Wednesday, January 1, 2014 | 7221400000 | 1836105000 |
| Thursday, January 1, 2015 | 6427600000 | 1920253000 |
| Friday, January 1, 2016 | 6840300000 | 1997259000 |
| Sunday, January 1, 2017 | 7269800000 | 2226900000 |
| Monday, January 1, 2018 | 7842600000 | 2566200000 |
| Tuesday, January 1, 2019 | 8086600000 | 2818300000 |
| Wednesday, January 1, 2020 | 8445100000 | 3079500000 |
| Friday, January 1, 2021 | 8640300000 | 3233700000 |
| Saturday, January 1, 2022 | 9461900000 | 3764800000 |
| Sunday, January 1, 2023 | 9953400000 | 3992200000 |
| Monday, January 1, 2024 | 10476700000 | 4144100000 |
Unlocking the unknown
In the ever-evolving landscape of corporate finance, understanding cost structures is pivotal. This analysis delves into the cost of revenue trends for Automatic Data Processing, Inc. (ADP) and Fastenal Company from 2014 to 2024. Over this decade, ADP's cost of revenue has surged by approximately 45%, reflecting its expanding operational scale. In contrast, Fastenal Company has seen a more modest increase of around 126%, indicating a robust growth trajectory in its cost structure.
These trends underscore the dynamic nature of cost management in different sectors, offering valuable insights for investors and analysts alike.
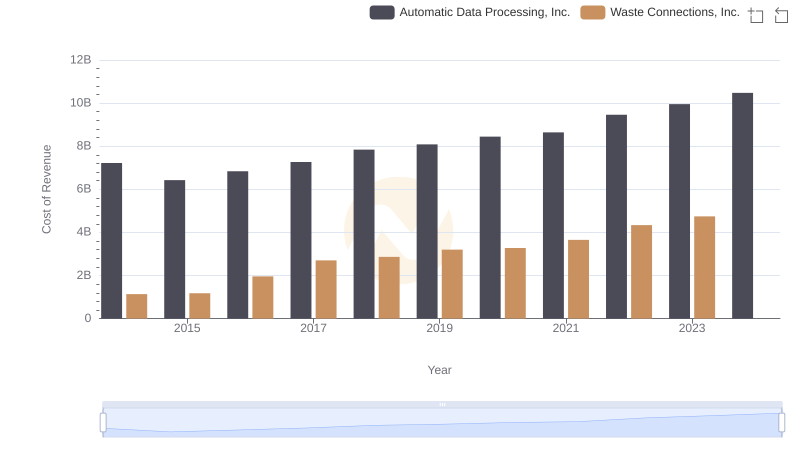
Cost Insights: Breaking Down Automatic Data Processing, Inc. and Waste Connections, Inc.'s Expenses
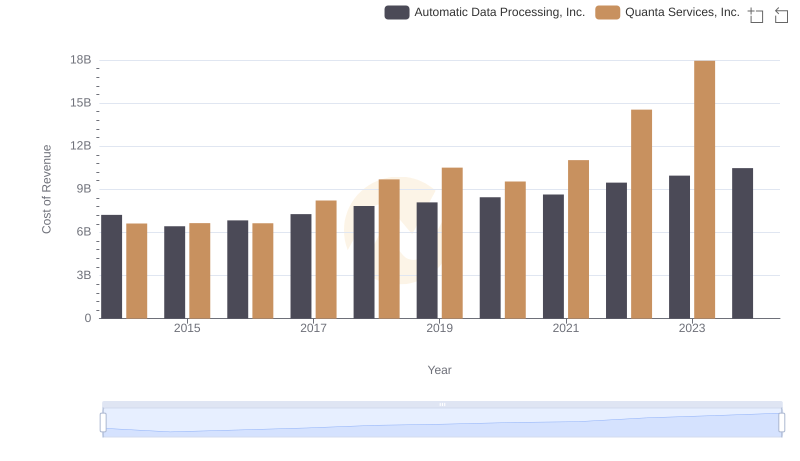
Analyzing Cost of Revenue: Automatic Data Processing, Inc. and Quanta Services, Inc.
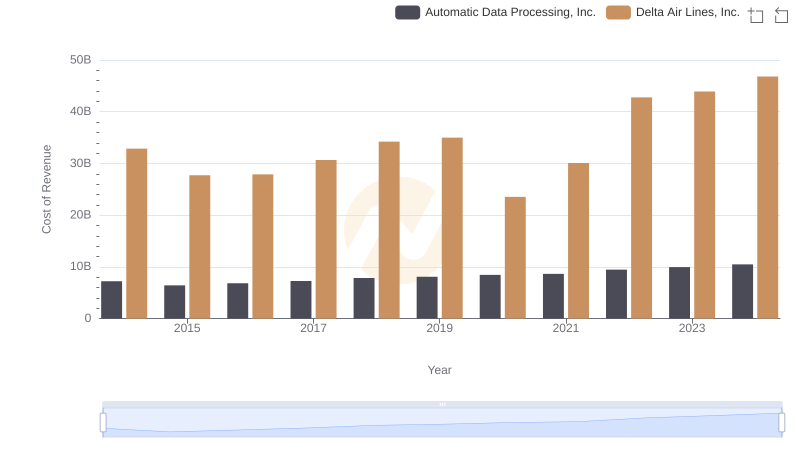
Comparing Cost of Revenue Efficiency: Automatic Data Processing, Inc. vs Delta Air Lines, Inc.
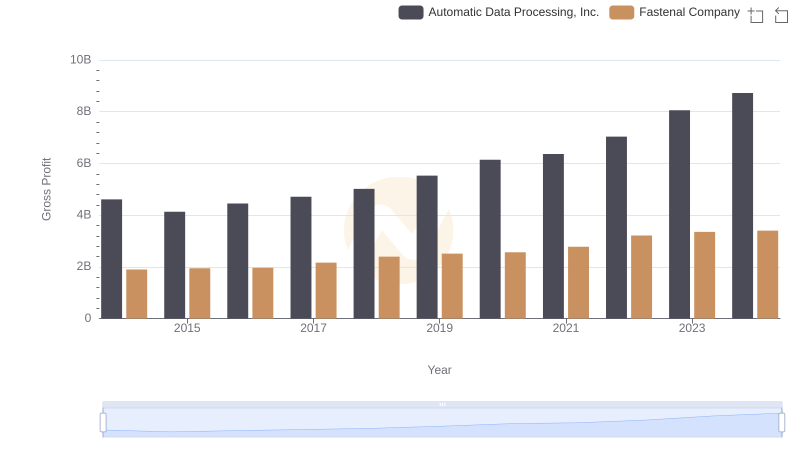
Gross Profit Trends Compared: Automatic Data Processing, Inc. vs Fastenal Company
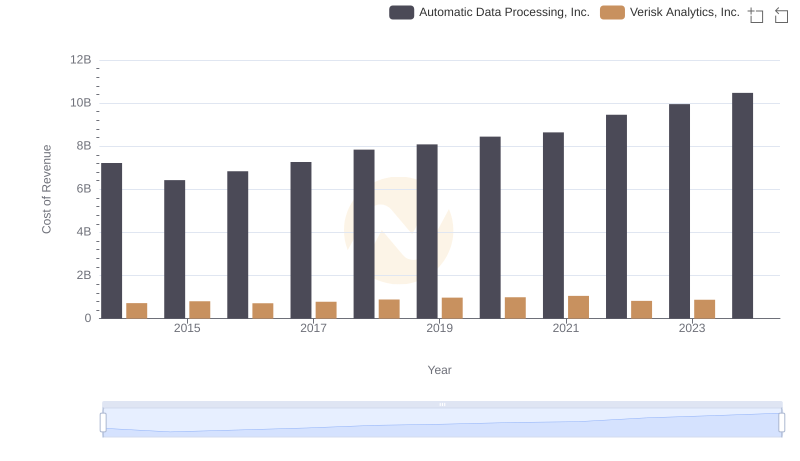
Cost of Revenue Trends: Automatic Data Processing, Inc. vs Verisk Analytics, Inc.

Automatic Data Processing, Inc. vs Fastenal Company: SG&A Expense Trends