| __timestamp | Automatic Data Processing, Inc. | Quanta Services, Inc. |
|---|---|---|
| Wednesday, January 1, 2014 | 7221400000 | 6617730000 |
| Thursday, January 1, 2015 | 6427600000 | 6648771000 |
| Friday, January 1, 2016 | 6840300000 | 6637519000 |
| Sunday, January 1, 2017 | 7269800000 | 8224618000 |
| Monday, January 1, 2018 | 7842600000 | 9691459000 |
| Tuesday, January 1, 2019 | 8086600000 | 10511901000 |
| Wednesday, January 1, 2020 | 8445100000 | 9541825000 |
| Friday, January 1, 2021 | 8640300000 | 11026954000 |
| Saturday, January 1, 2022 | 9461900000 | 14544748000 |
| Sunday, January 1, 2023 | 9953400000 | 17945120000 |
| Monday, January 1, 2024 | 10476700000 |
Unleashing insights
In the ever-evolving landscape of corporate finance, understanding the cost of revenue is crucial for evaluating a company's efficiency and profitability. This analysis delves into the financial journeys of Automatic Data Processing, Inc. (ADP) and Quanta Services, Inc. over the past decade.
From 2014 to 2023, ADP's cost of revenue has shown a steady increase, rising approximately 45% from 2014 to 2023. Meanwhile, Quanta Services, Inc. has experienced a more dramatic surge, with its cost of revenue nearly tripling over the same period. This stark contrast highlights the differing growth trajectories and operational strategies of these two industry leaders.
While the data for 2024 is incomplete, the trends observed suggest continued growth for both companies. As we look to the future, these insights provide a valuable lens through which to assess potential investment opportunities.
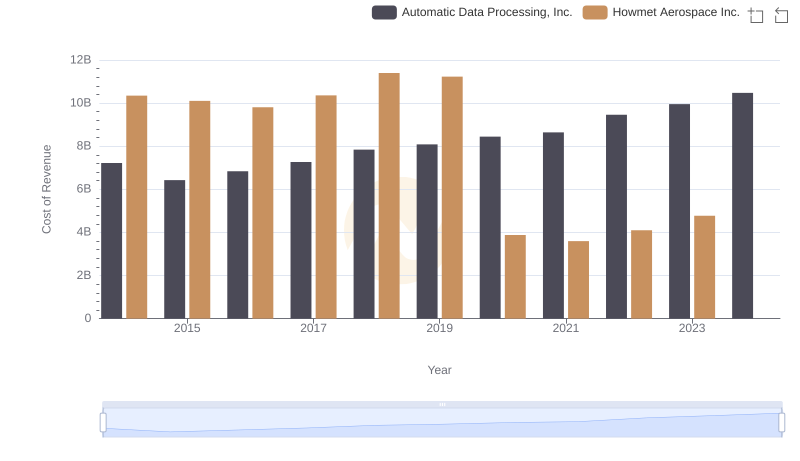
Analyzing Cost of Revenue: Automatic Data Processing, Inc. and Howmet Aerospace Inc.
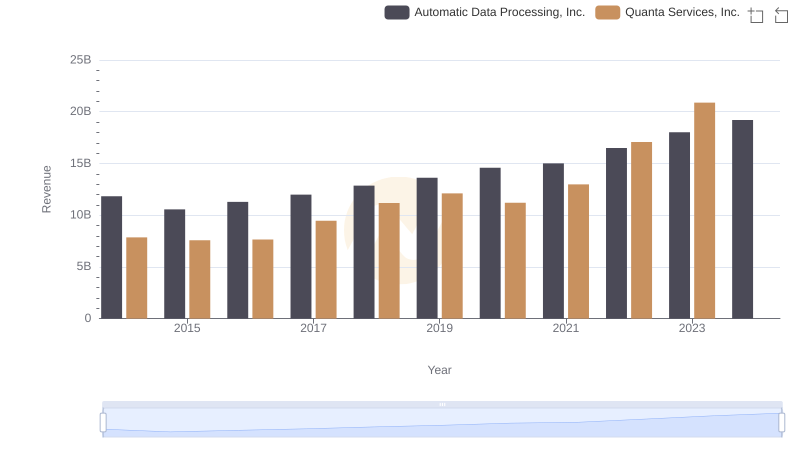
Automatic Data Processing, Inc. vs Quanta Services, Inc.: Examining Key Revenue Metrics
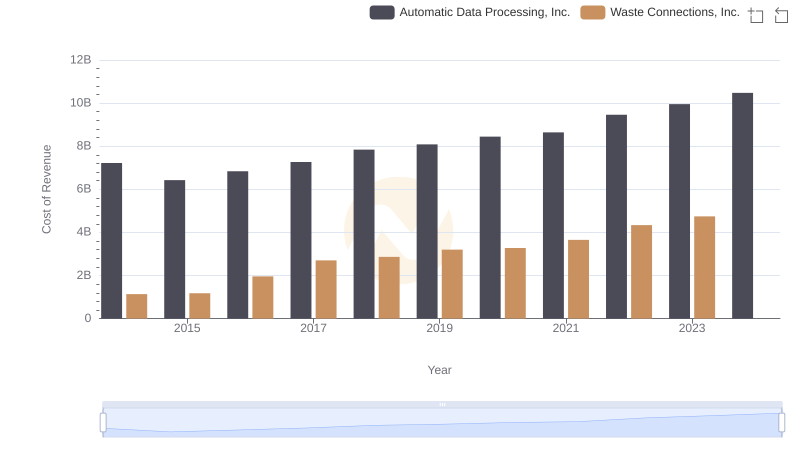
Cost Insights: Breaking Down Automatic Data Processing, Inc. and Waste Connections, Inc.'s Expenses
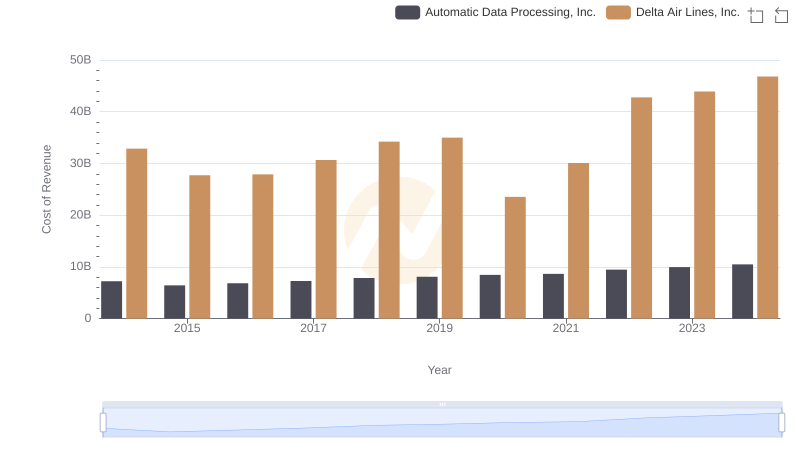
Comparing Cost of Revenue Efficiency: Automatic Data Processing, Inc. vs Delta Air Lines, Inc.
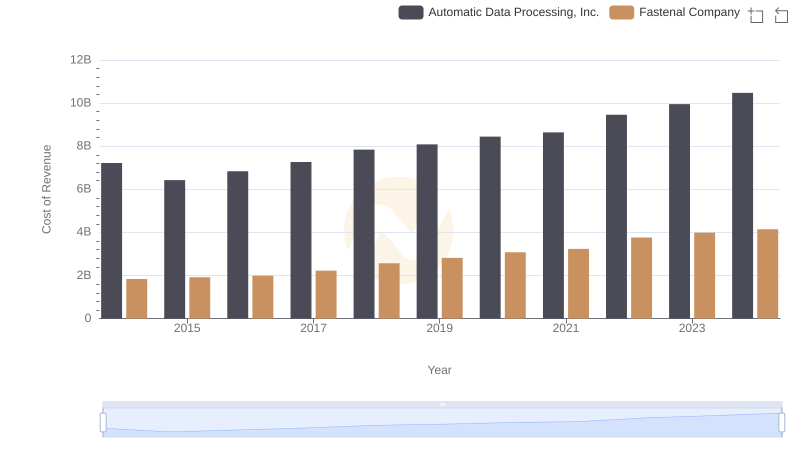
Cost of Revenue Trends: Automatic Data Processing, Inc. vs Fastenal Company
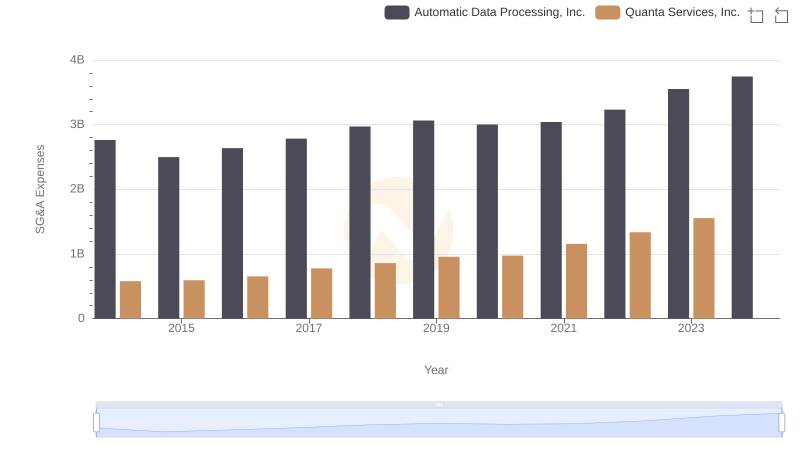
Selling, General, and Administrative Costs: Automatic Data Processing, Inc. vs Quanta Services, Inc.
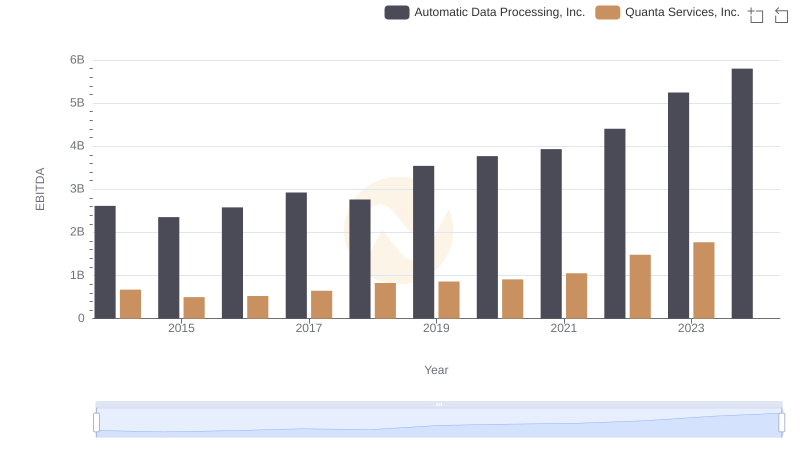
Automatic Data Processing, Inc. vs Quanta Services, Inc.: In-Depth EBITDA Performance Comparison