| __timestamp | Automatic Data Processing, Inc. | Fastenal Company |
|---|---|---|
| Wednesday, January 1, 2014 | 2762400000 | 1110776000 |
| Thursday, January 1, 2015 | 2496900000 | 1121590000 |
| Friday, January 1, 2016 | 2637000000 | 1169470000 |
| Sunday, January 1, 2017 | 2783200000 | 1282800000 |
| Monday, January 1, 2018 | 2971500000 | 1400200000 |
| Tuesday, January 1, 2019 | 3064200000 | 1459400000 |
| Wednesday, January 1, 2020 | 3003000000 | 1427400000 |
| Friday, January 1, 2021 | 3040500000 | 1559800000 |
| Saturday, January 1, 2022 | 3233200000 | 1762200000 |
| Sunday, January 1, 2023 | 3551400000 | 1825800000 |
| Monday, January 1, 2024 | 3778900000 | 1891900000 |
Cracking the code
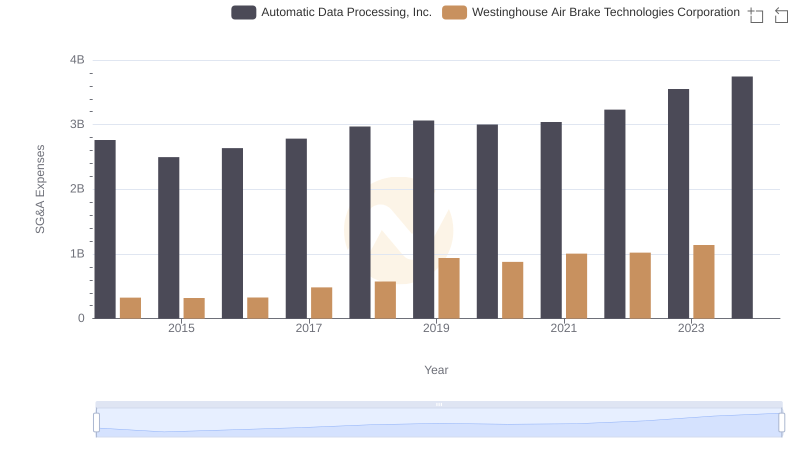
In the world of corporate finance, understanding the trends in Selling, General, and Administrative (SG&A) expenses can offer valuable insights into a company's operational efficiency. This analysis focuses on the SG&A expense trends of Automatic Data Processing, Inc. (ADP) and Fastenal Company from 2014 to 2024.
Over the past decade, ADP has seen a steady increase in its SG&A expenses, growing by approximately 36% from 2014 to 2024. This growth reflects the company's expanding operations and investment in administrative capabilities. In contrast, Fastenal Company has experienced a more moderate increase of about 70% in the same period, indicating a different strategic approach to managing operational costs.
These trends highlight the differing strategies of these two industry giants. While ADP's larger increase suggests a focus on scaling and administrative expansion, Fastenal's more conservative growth may indicate a focus on cost efficiency and streamlined operations. Understanding these trends can provide investors and analysts with deeper insights into each company's strategic priorities.
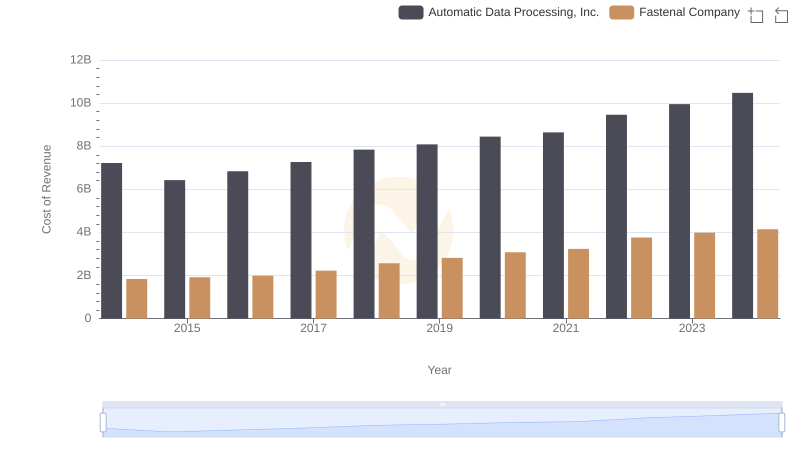
Cost of Revenue Trends: Automatic Data Processing, Inc. vs Fastenal Company
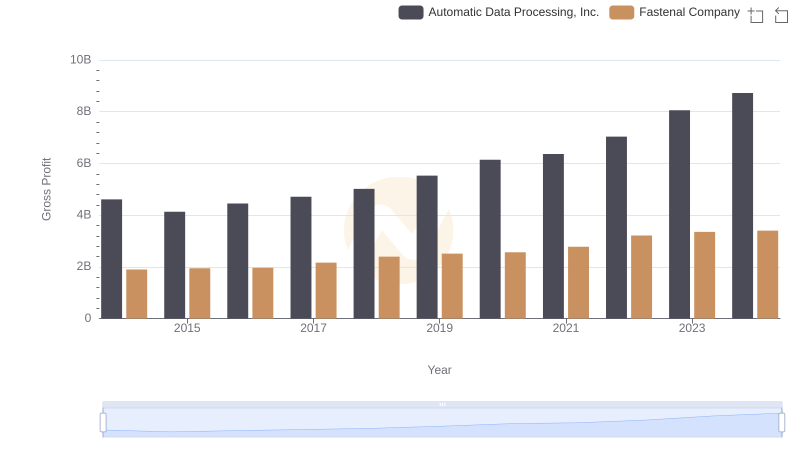
Gross Profit Trends Compared: Automatic Data Processing, Inc. vs Fastenal Company
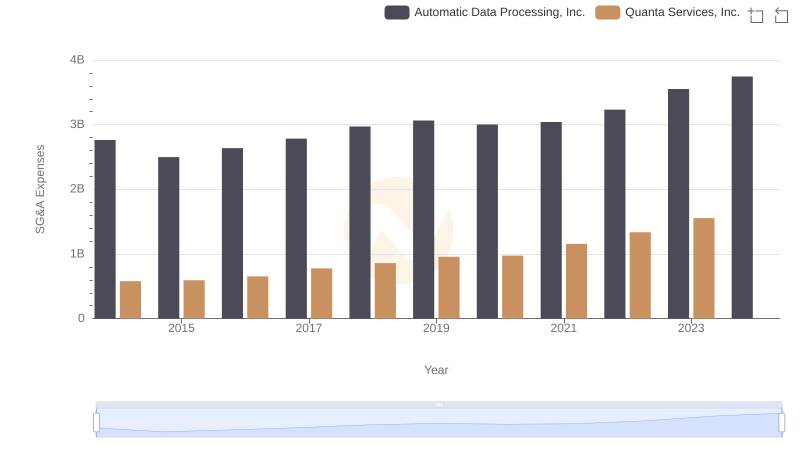
Selling, General, and Administrative Costs: Automatic Data Processing, Inc. vs Quanta Services, Inc.

Who Optimizes SG&A Costs Better? Automatic Data Processing, Inc. or Verisk Analytics, Inc.
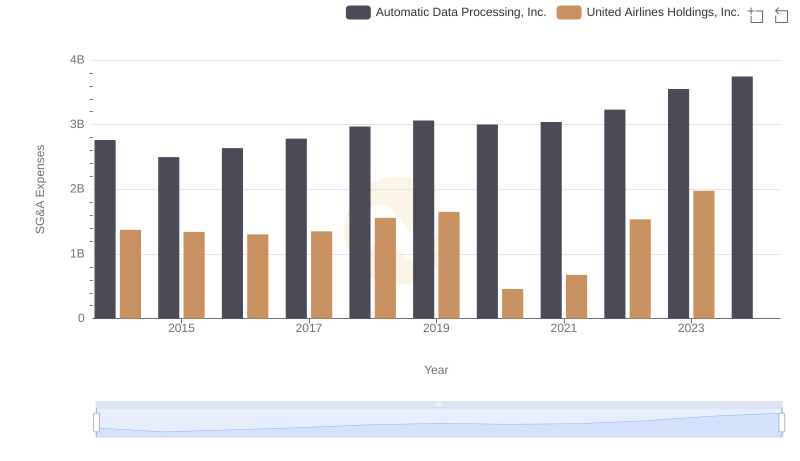
Breaking Down SG&A Expenses: Automatic Data Processing, Inc. vs United Airlines Holdings, Inc.
Comparing SG&A Expenses: Automatic Data Processing, Inc. vs Westinghouse Air Brake Technologies Corporation Trends and Insights