| __timestamp | Automatic Data Processing, Inc. | Delta Air Lines, Inc. |
|---|---|---|
| Wednesday, January 1, 2014 | 7221400000 | 32858000000 |
| Thursday, January 1, 2015 | 6427600000 | 27707000000 |
| Friday, January 1, 2016 | 6840300000 | 27876000000 |
| Sunday, January 1, 2017 | 7269800000 | 30671000000 |
| Monday, January 1, 2018 | 7842600000 | 34209000000 |
| Tuesday, January 1, 2019 | 8086600000 | 34982000000 |
| Wednesday, January 1, 2020 | 8445100000 | 23546000000 |
| Friday, January 1, 2021 | 8640300000 | 30078000000 |
| Saturday, January 1, 2022 | 9461900000 | 42767000000 |
| Sunday, January 1, 2023 | 9953400000 | 43913000000 |
| Monday, January 1, 2024 | 10476700000 | 46801000000 |
Infusing magic into the data realm
In the ever-evolving landscape of corporate America, understanding cost efficiency is paramount. This analysis juxtaposes the cost of revenue for Automatic Data Processing, Inc. (ADP) and Delta Air Lines, Inc. (DAL) from 2014 to 2024. Over this decade, ADP's cost of revenue has grown by approximately 45%, reflecting a steady increase in operational efficiency. In contrast, Delta Air Lines has seen a more volatile trajectory, with a 42% rise, highlighting the challenges faced by the airline industry, especially during the pandemic years.
This comparison underscores the diverse challenges and strategies in managing revenue costs across different sectors.
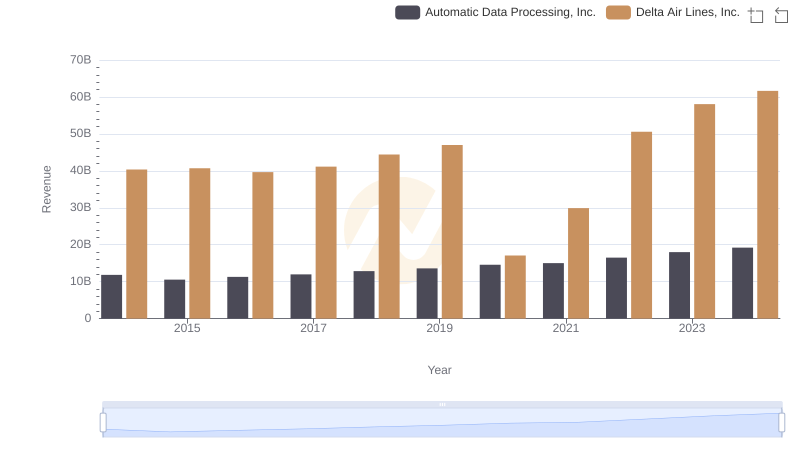
Revenue Showdown: Automatic Data Processing, Inc. vs Delta Air Lines, Inc.
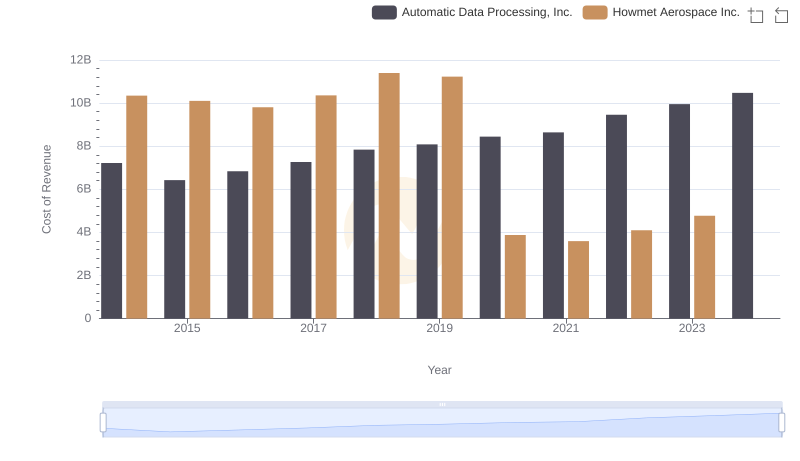
Analyzing Cost of Revenue: Automatic Data Processing, Inc. and Howmet Aerospace Inc.
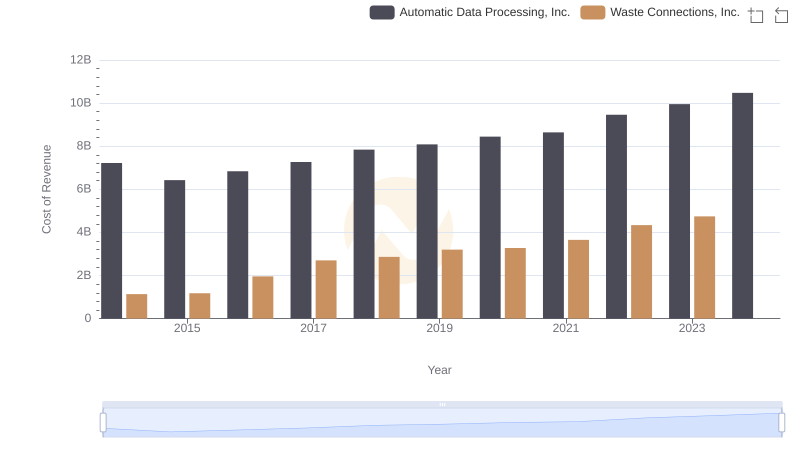
Cost Insights: Breaking Down Automatic Data Processing, Inc. and Waste Connections, Inc.'s Expenses
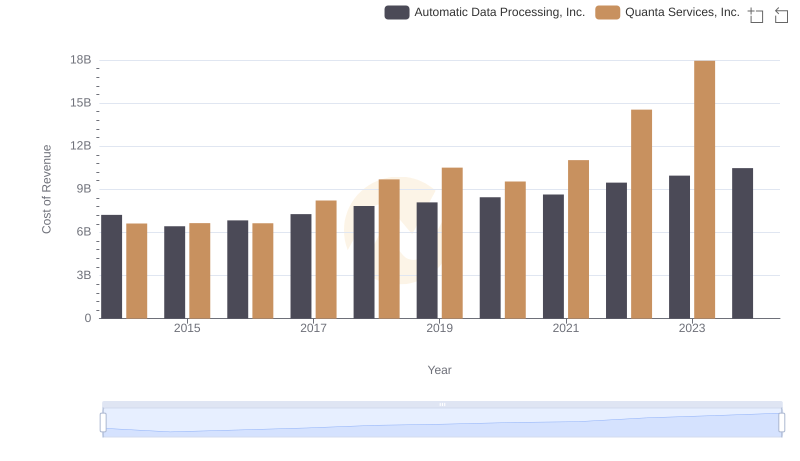
Analyzing Cost of Revenue: Automatic Data Processing, Inc. and Quanta Services, Inc.
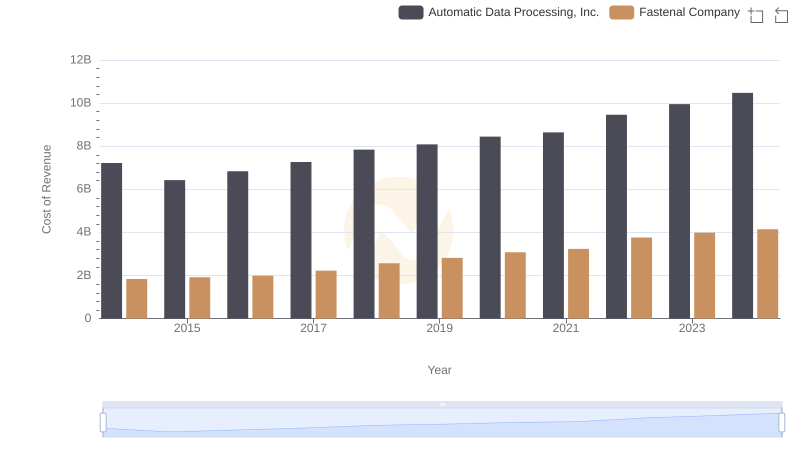
Cost of Revenue Trends: Automatic Data Processing, Inc. vs Fastenal Company
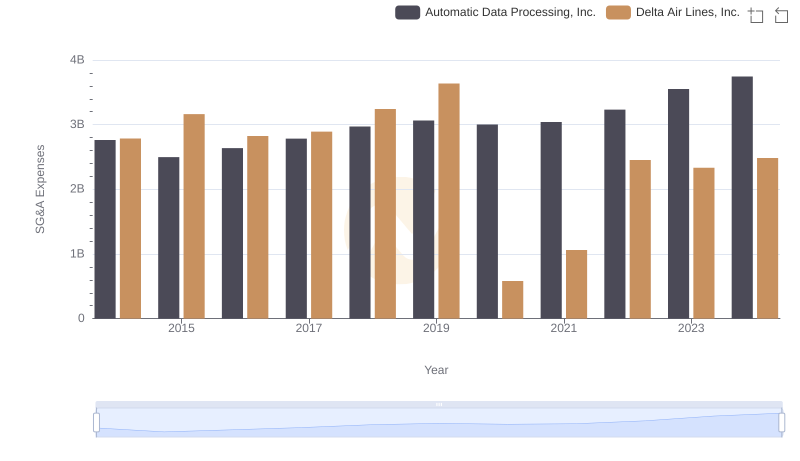
Automatic Data Processing, Inc. and Delta Air Lines, Inc.: SG&A Spending Patterns Compared