| __timestamp | Adobe Inc. | Gen Digital Inc. |
|---|---|---|
| Wednesday, January 1, 2014 | 622080000 | 1149000000 |
| Thursday, January 1, 2015 | 744317000 | 1153000000 |
| Friday, January 1, 2016 | 819908000 | 615000000 |
| Sunday, January 1, 2017 | 1010491000 | 853000000 |
| Monday, January 1, 2018 | 1194999000 | 1032000000 |
| Tuesday, January 1, 2019 | 1672720000 | 1050000000 |
| Wednesday, January 1, 2020 | 1722000000 | 393000000 |
| Friday, January 1, 2021 | 1865000000 | 362000000 |
| Saturday, January 1, 2022 | 2165000000 | 408000000 |
| Sunday, January 1, 2023 | 2354000000 | 589000000 |
| Monday, January 1, 2024 | 2358000000 | 731000000 |
Infusing magic into the data realm
In the ever-evolving tech industry, understanding cost dynamics is crucial. Over the past decade, Adobe Inc. has seen a remarkable 280% increase in its cost of revenue, reflecting its aggressive growth and expansion strategies. Starting from 2014, Adobe's cost of revenue surged from approximately $622 million to over $2.35 billion by 2024. This trend underscores Adobe's commitment to innovation and market leadership.
Conversely, Gen Digital Inc. experienced a more volatile journey. From a peak in 2015, its cost of revenue dropped by nearly 68% by 2021, before rebounding to $731 million in 2024. This fluctuation highlights the challenges and strategic shifts within Gen Digital's operations.
These trends offer a fascinating glimpse into how two tech giants navigate their financial landscapes, providing valuable insights for investors and industry enthusiasts alike.
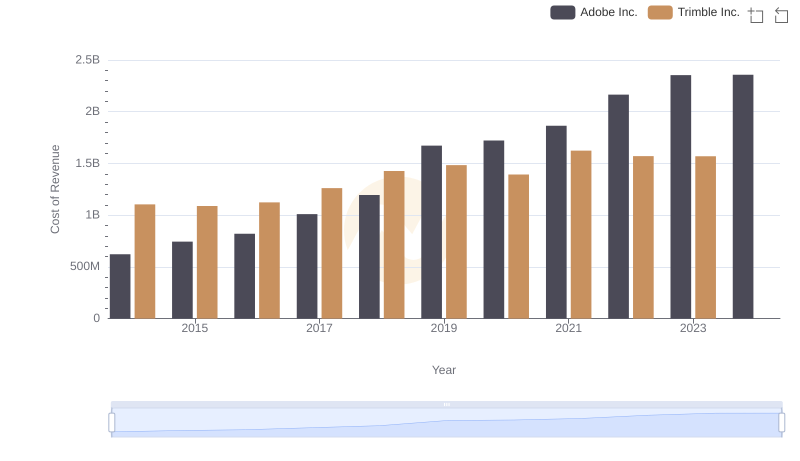
Cost Insights: Breaking Down Adobe Inc. and Trimble Inc.'s Expenses
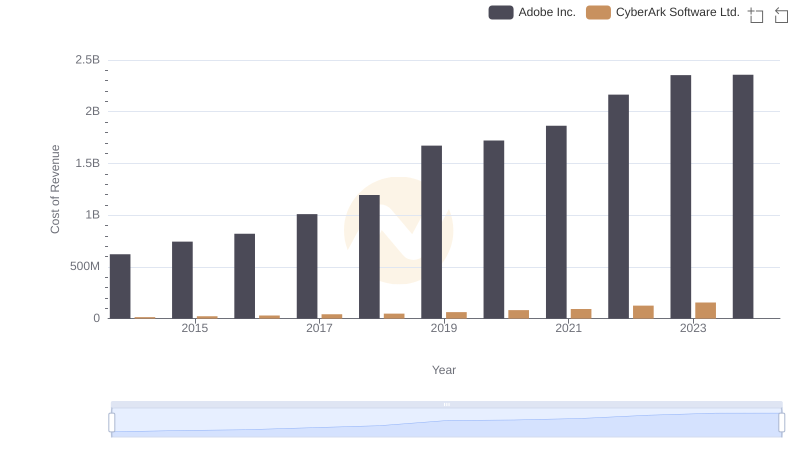
Cost Insights: Breaking Down Adobe Inc. and CyberArk Software Ltd.'s Expenses

Adobe Inc. vs Teradyne, Inc.: Efficiency in Cost of Revenue Explored
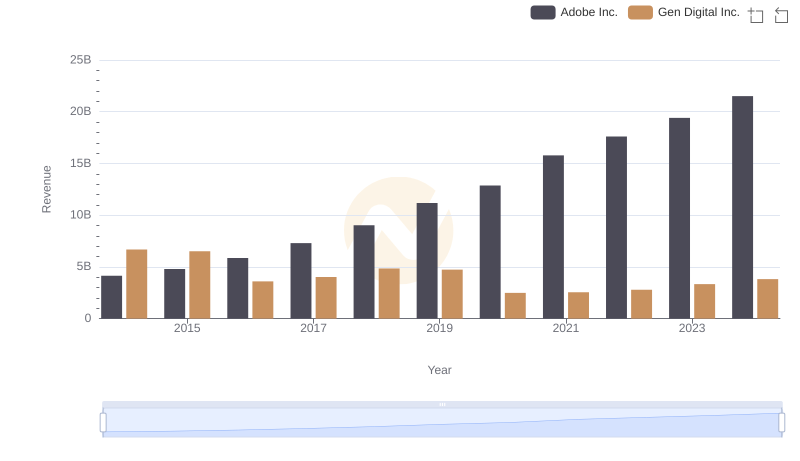
Who Generates More Revenue? Adobe Inc. or Gen Digital Inc.
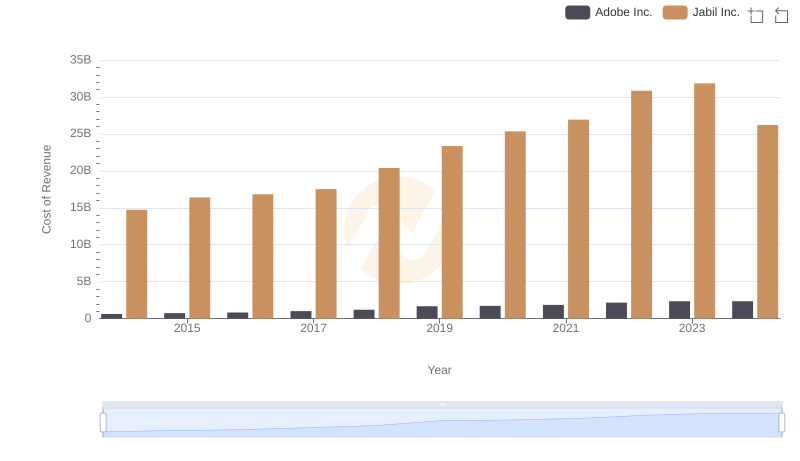
Comparing Cost of Revenue Efficiency: Adobe Inc. vs Jabil Inc.
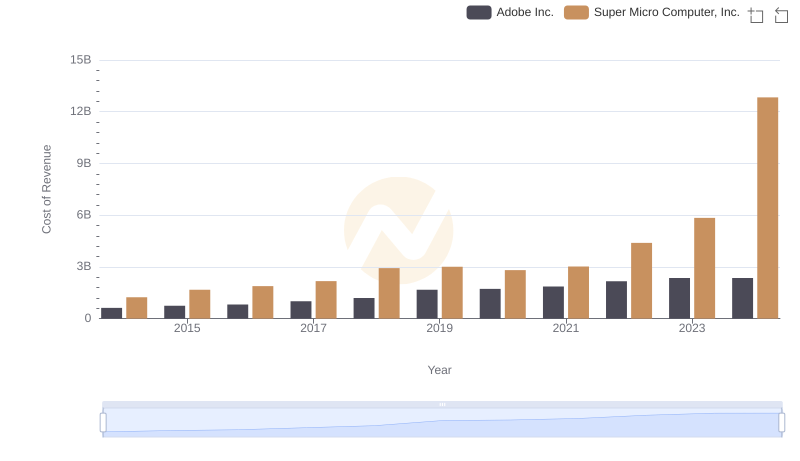
Cost Insights: Breaking Down Adobe Inc. and Super Micro Computer, Inc.'s Expenses
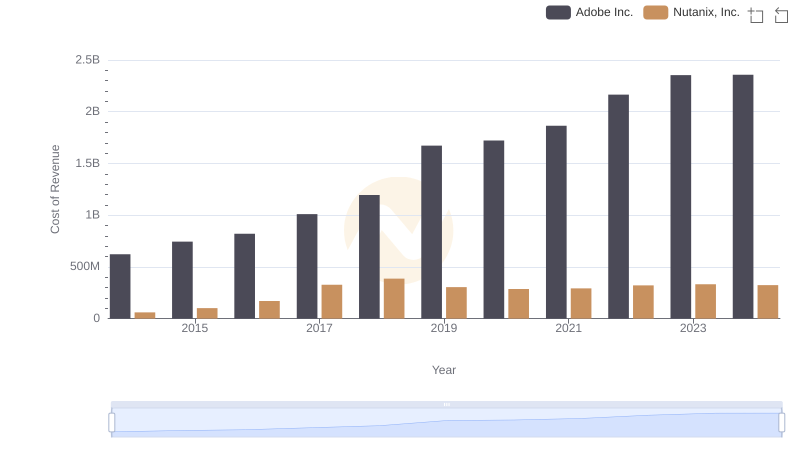
Cost of Revenue Comparison: Adobe Inc. vs Nutanix, Inc.
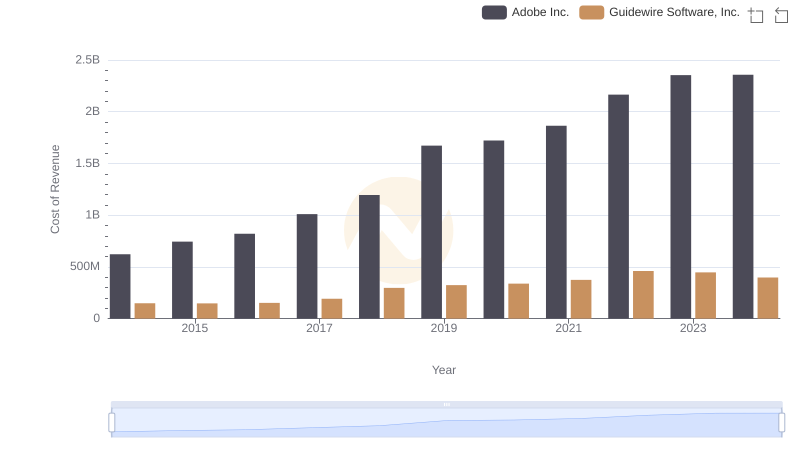
Cost Insights: Breaking Down Adobe Inc. and Guidewire Software, Inc.'s Expenses
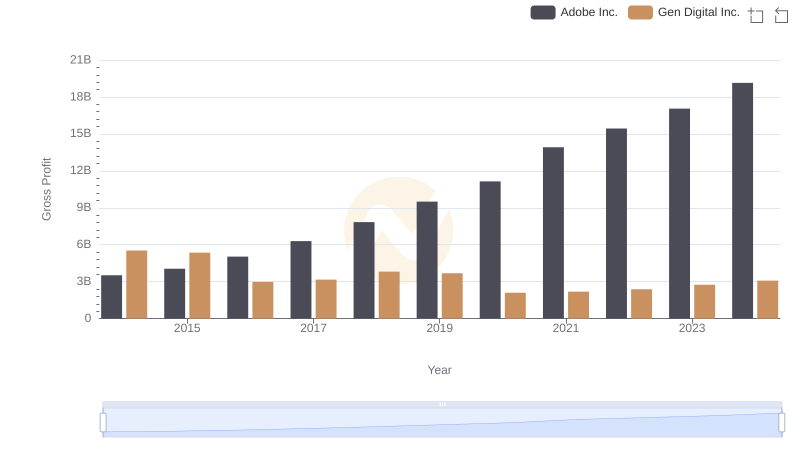
Adobe Inc. and Gen Digital Inc.: A Detailed Gross Profit Analysis
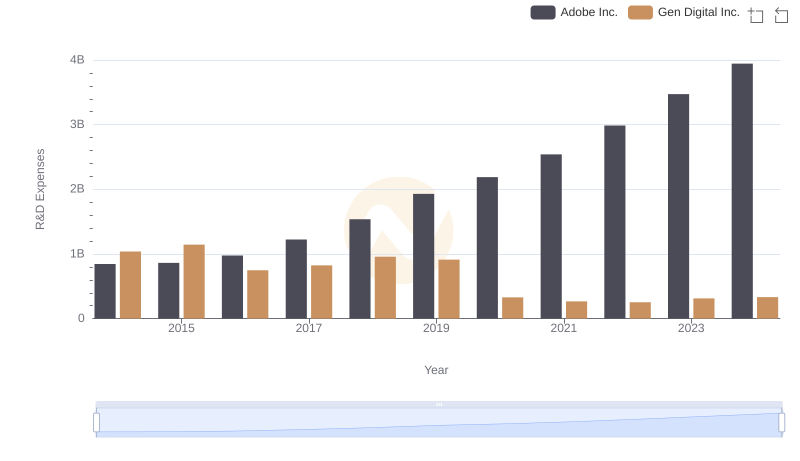
Research and Development: Comparing Key Metrics for Adobe Inc. and Gen Digital Inc.
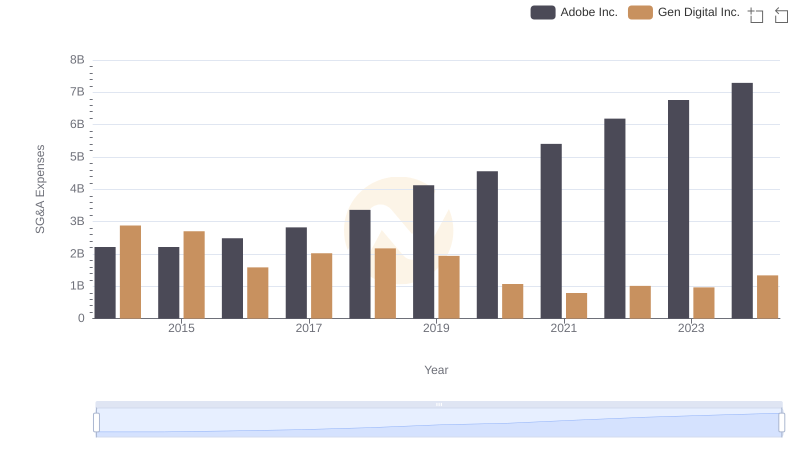
Cost Management Insights: SG&A Expenses for Adobe Inc. and Gen Digital Inc.
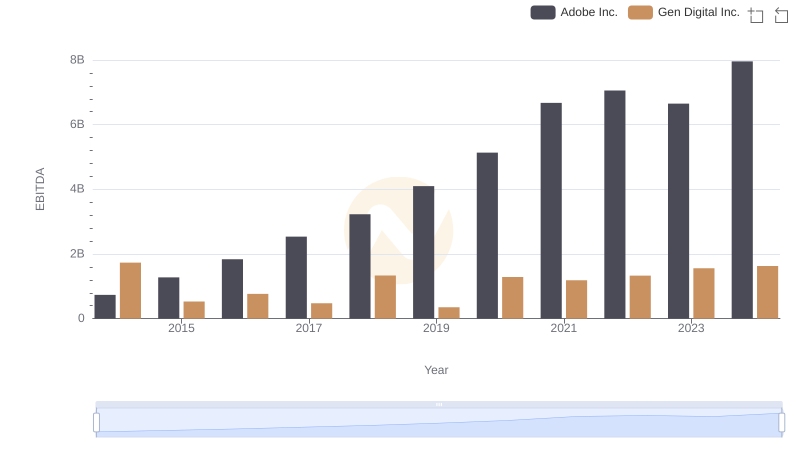
Comparative EBITDA Analysis: Adobe Inc. vs Gen Digital Inc.