| __timestamp | Adobe Inc. | Gen Digital Inc. |
|---|---|---|
| Wednesday, January 1, 2014 | 3524985000 | 5527000000 |
| Thursday, January 1, 2015 | 4051194000 | 5355000000 |
| Friday, January 1, 2016 | 5034522000 | 2985000000 |
| Sunday, January 1, 2017 | 6291014000 | 3166000000 |
| Monday, January 1, 2018 | 7835009000 | 3814000000 |
| Tuesday, January 1, 2019 | 9498577000 | 3681000000 |
| Wednesday, January 1, 2020 | 11146000000 | 2097000000 |
| Friday, January 1, 2021 | 13920000000 | 2189000000 |
| Saturday, January 1, 2022 | 15441000000 | 2388000000 |
| Sunday, January 1, 2023 | 17055000000 | 2749000000 |
| Monday, January 1, 2024 | 19147000000 | 3081000000 |
Cracking the code
In the ever-evolving landscape of technology, Adobe Inc. and Gen Digital Inc. have carved distinct paths in their financial journeys. Over the past decade, Adobe has demonstrated a remarkable growth trajectory, with its gross profit surging by over 440% from 2014 to 2024. This impressive rise reflects Adobe's strategic innovations and market adaptability, positioning it as a leader in digital media and marketing solutions.
Conversely, Gen Digital Inc. has faced a more turbulent path. Despite a strong start in 2014, with a gross profit of approximately 5.5 billion, the company experienced a decline, reaching a low in 2020. However, recent years have shown signs of recovery, with a 47% increase in gross profit from 2020 to 2024.
This analysis underscores the dynamic nature of the tech industry, where adaptability and innovation are key to sustained success.
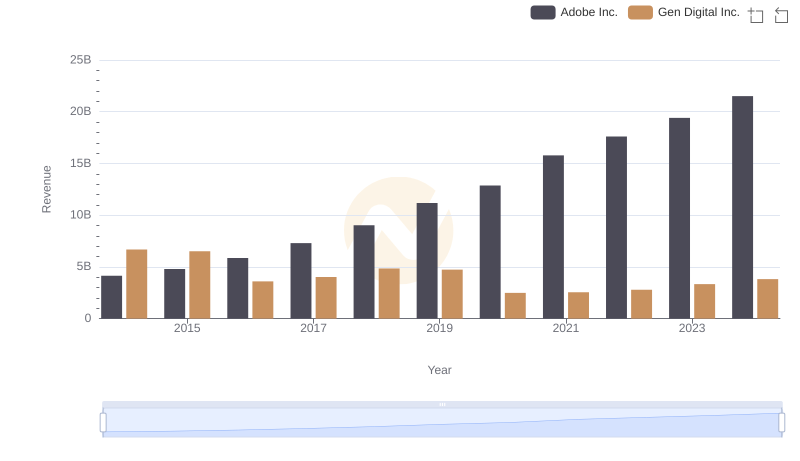
Who Generates More Revenue? Adobe Inc. or Gen Digital Inc.
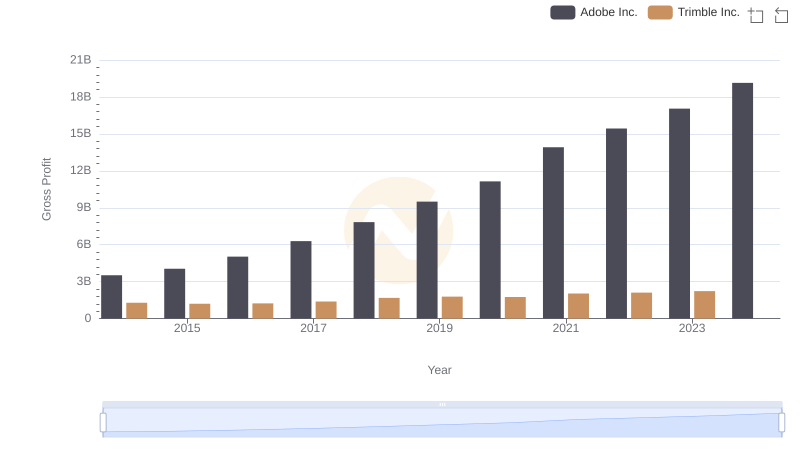
Who Generates Higher Gross Profit? Adobe Inc. or Trimble Inc.
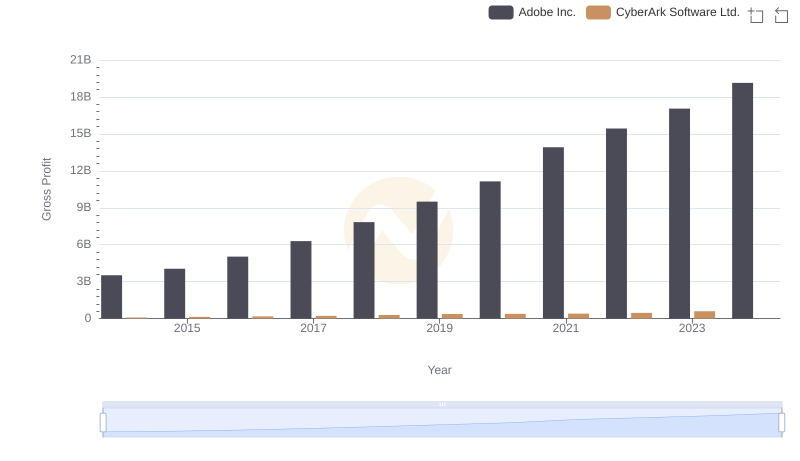
Who Generates Higher Gross Profit? Adobe Inc. or CyberArk Software Ltd.

Gross Profit Comparison: Adobe Inc. and Teradyne, Inc. Trends
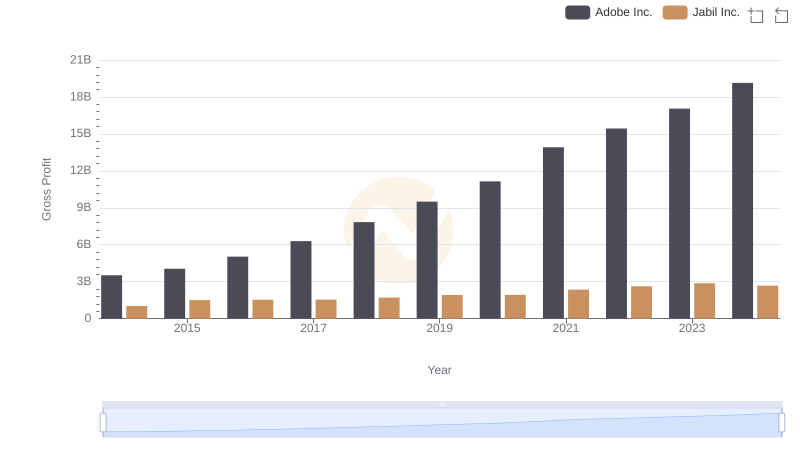
Gross Profit Trends Compared: Adobe Inc. vs Jabil Inc.
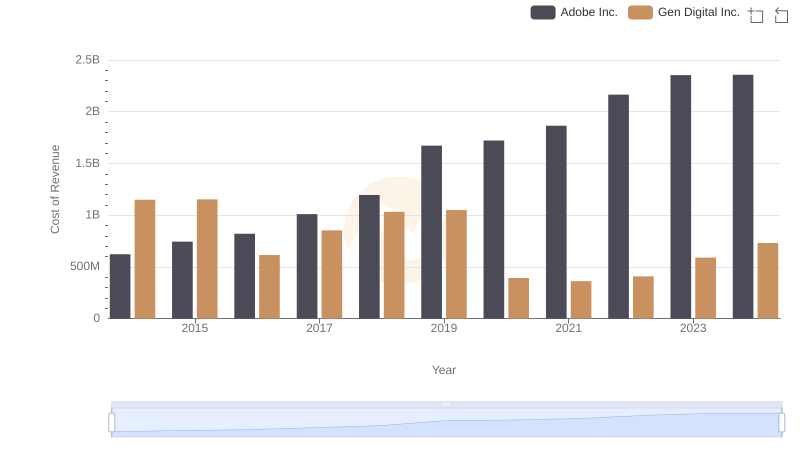
Cost of Revenue Trends: Adobe Inc. vs Gen Digital Inc.
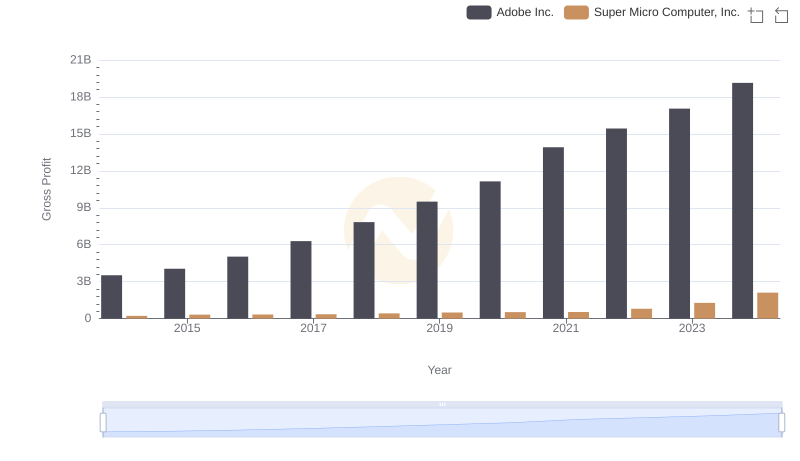
Adobe Inc. and Super Micro Computer, Inc.: A Detailed Gross Profit Analysis
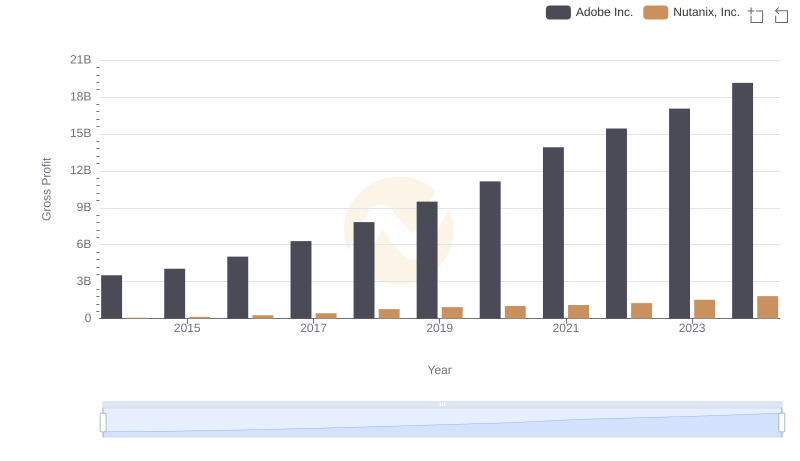
Adobe Inc. and Nutanix, Inc.: A Detailed Gross Profit Analysis
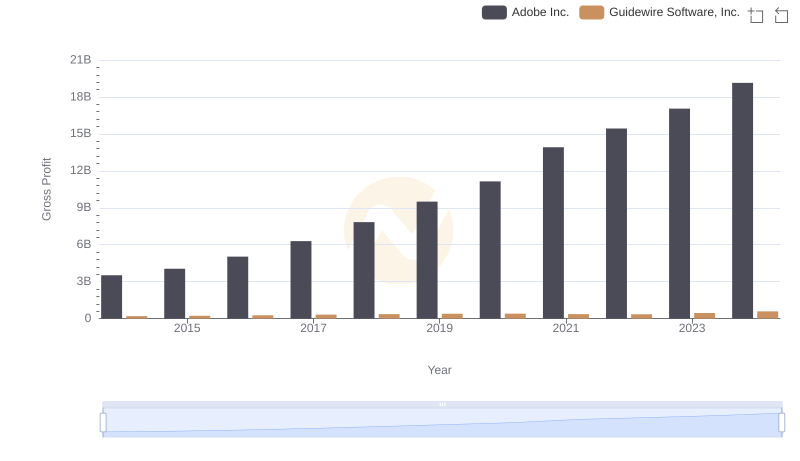
Gross Profit Analysis: Comparing Adobe Inc. and Guidewire Software, Inc.
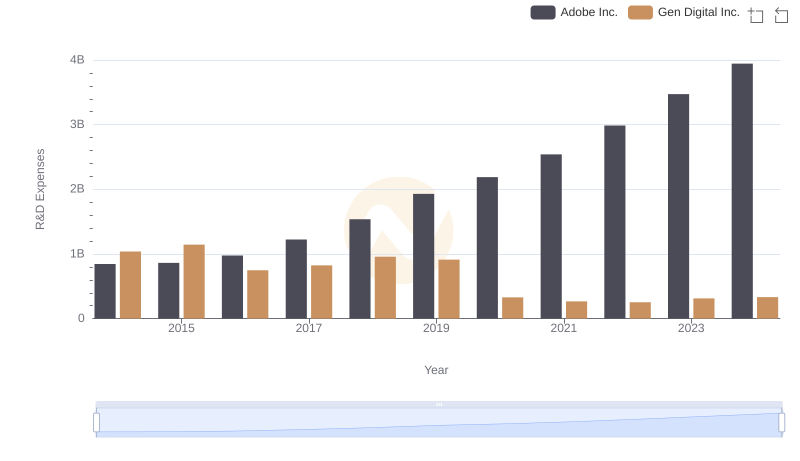
Research and Development: Comparing Key Metrics for Adobe Inc. and Gen Digital Inc.
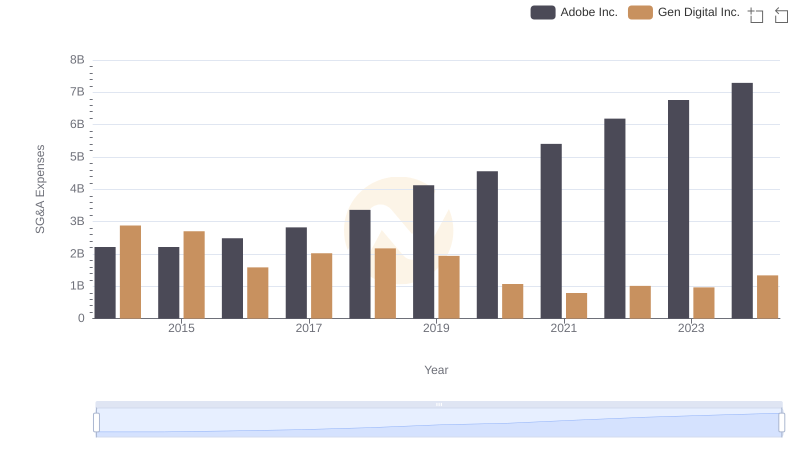
Cost Management Insights: SG&A Expenses for Adobe Inc. and Gen Digital Inc.
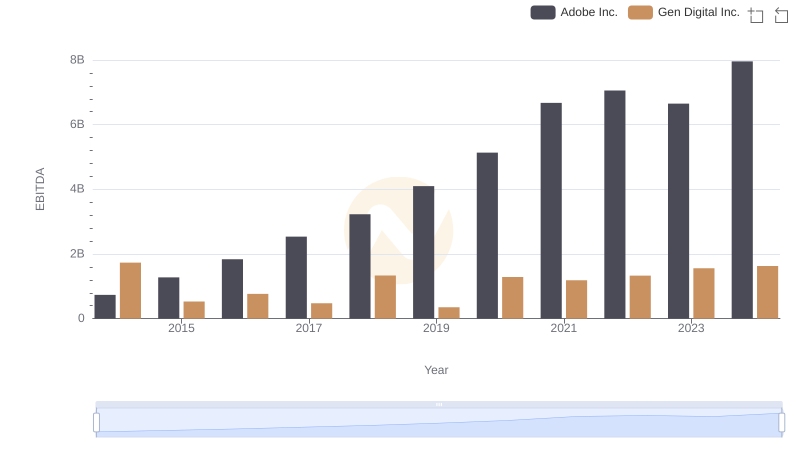
Comparative EBITDA Analysis: Adobe Inc. vs Gen Digital Inc.