| __timestamp | Adobe Inc. | Jabil Inc. |
|---|---|---|
| Wednesday, January 1, 2014 | 622080000 | 14736543000 |
| Thursday, January 1, 2015 | 744317000 | 16395978000 |
| Friday, January 1, 2016 | 819908000 | 16825382000 |
| Sunday, January 1, 2017 | 1010491000 | 17517478000 |
| Monday, January 1, 2018 | 1194999000 | 20388624000 |
| Tuesday, January 1, 2019 | 1672720000 | 23368919000 |
| Wednesday, January 1, 2020 | 1722000000 | 25335625000 |
| Friday, January 1, 2021 | 1865000000 | 26926000000 |
| Saturday, January 1, 2022 | 2165000000 | 30846000000 |
| Sunday, January 1, 2023 | 2354000000 | 31835000000 |
| Monday, January 1, 2024 | 2358000000 | 26207000000 |
In pursuit of knowledge
In the ever-evolving landscape of technology and manufacturing, Adobe Inc. and Jabil Inc. stand as titans in their respective fields. Over the past decade, from 2014 to 2024, these companies have showcased distinct trajectories in their cost of revenue efficiency. Adobe, a leader in digital media and marketing solutions, has seen its cost of revenue grow steadily, peaking at approximately 2.36 billion in 2024, marking a 279% increase from 2014. In contrast, Jabil, a global manufacturing services company, experienced a more volatile journey, with its cost of revenue reaching a high of 31.8 billion in 2023 before slightly declining to 26.2 billion in 2024. This represents a 78% increase from 2014. These trends highlight the contrasting business models and market dynamics each company navigates, offering valuable insights into their operational efficiencies and strategic priorities.
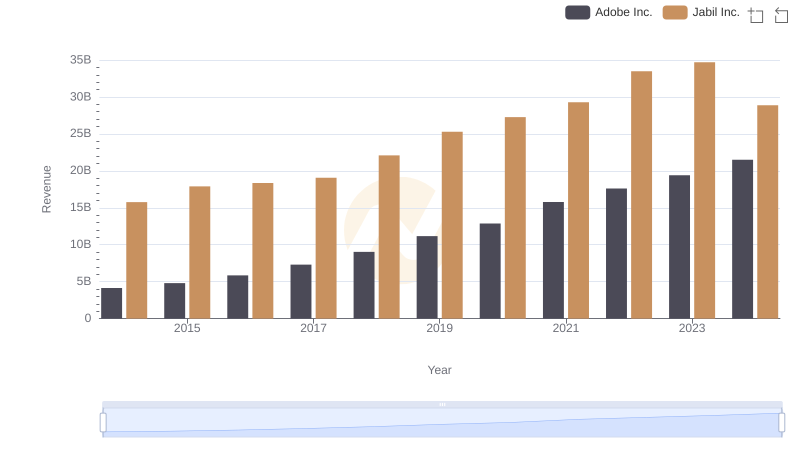
Adobe Inc. and Jabil Inc.: A Comprehensive Revenue Analysis
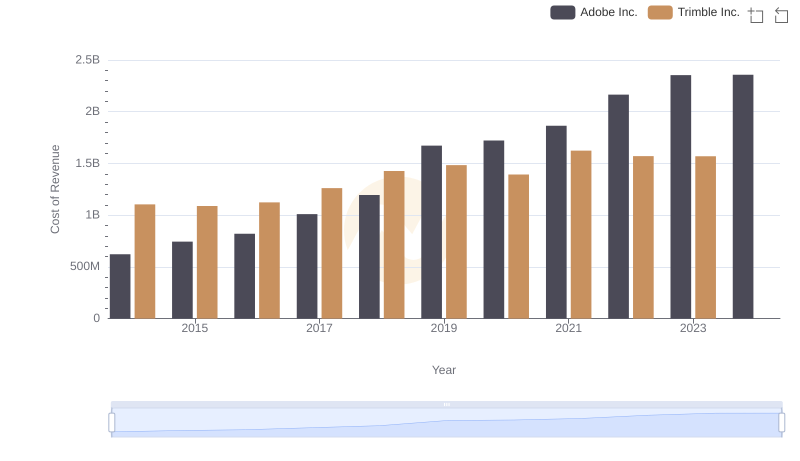
Cost Insights: Breaking Down Adobe Inc. and Trimble Inc.'s Expenses
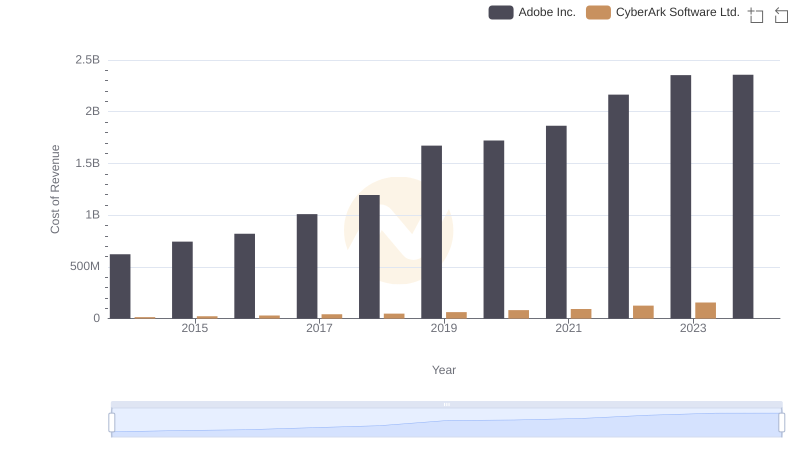
Cost Insights: Breaking Down Adobe Inc. and CyberArk Software Ltd.'s Expenses

Adobe Inc. vs Teradyne, Inc.: Efficiency in Cost of Revenue Explored
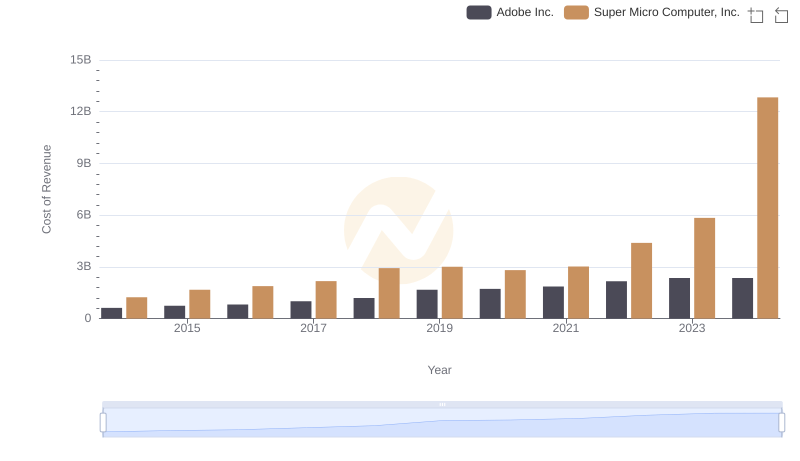
Cost Insights: Breaking Down Adobe Inc. and Super Micro Computer, Inc.'s Expenses
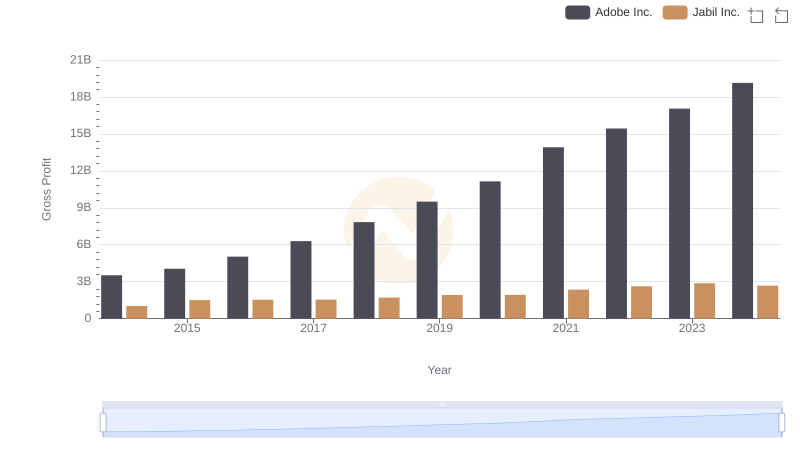
Gross Profit Trends Compared: Adobe Inc. vs Jabil Inc.
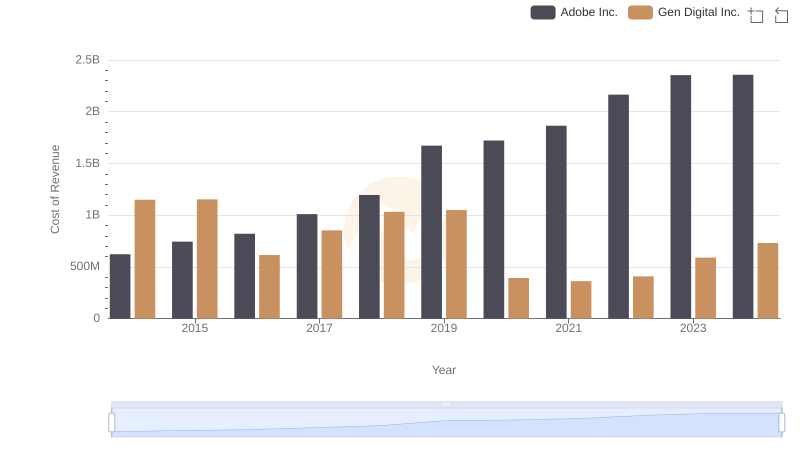
Cost of Revenue Trends: Adobe Inc. vs Gen Digital Inc.
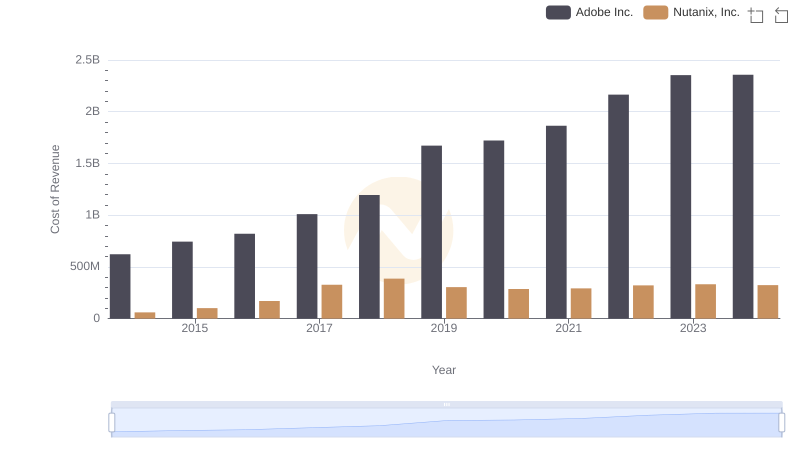
Cost of Revenue Comparison: Adobe Inc. vs Nutanix, Inc.
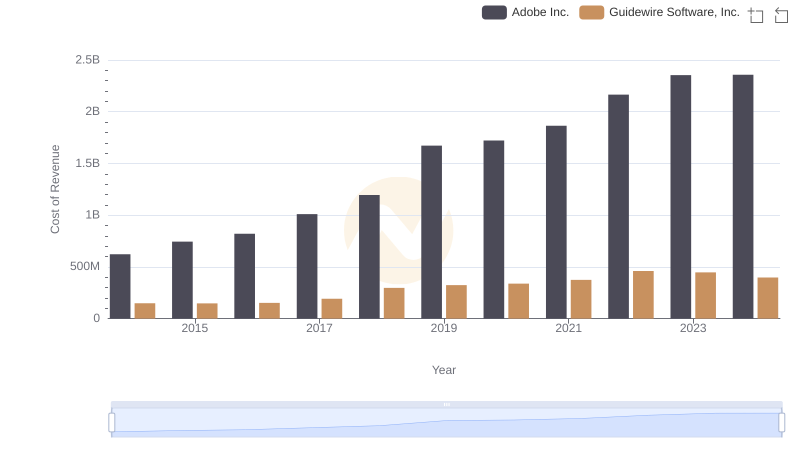
Cost Insights: Breaking Down Adobe Inc. and Guidewire Software, Inc.'s Expenses
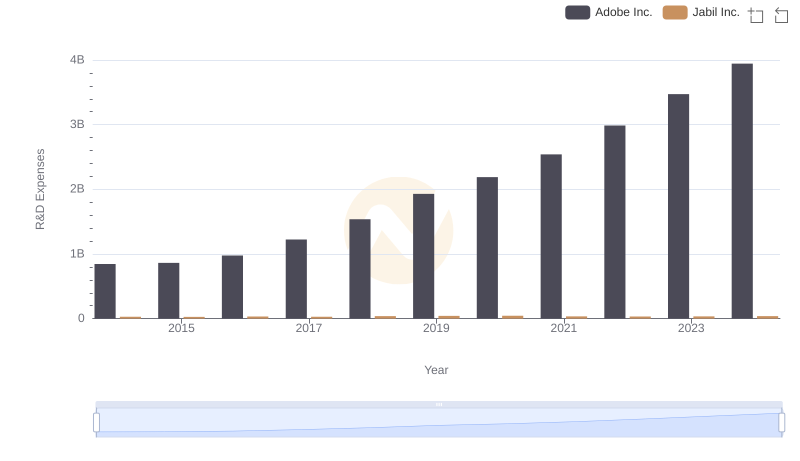
Comparing Innovation Spending: Adobe Inc. and Jabil Inc.
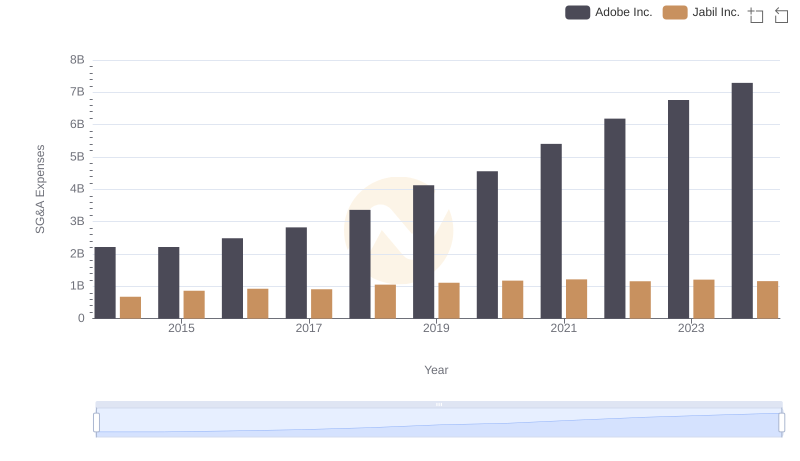
Breaking Down SG&A Expenses: Adobe Inc. vs Jabil Inc.
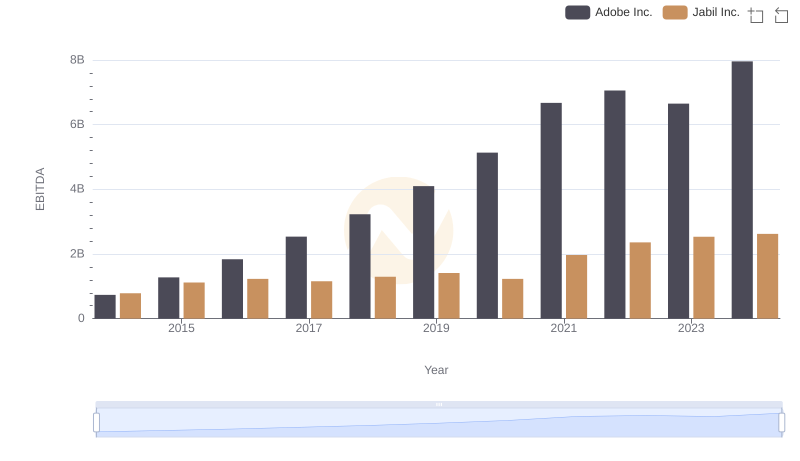
EBITDA Analysis: Evaluating Adobe Inc. Against Jabil Inc.